What is B2B product analytics?
B2B product analytics measures how customer organizations adopt and use software while retaining the user- and session-level behavior behind each result. The account is usually the entity that renews, expands, or churns; users perform the work that produces those outcomes.
| View | Primary unit | Question it answers |
|---|---|---|
| Website analytics | Visitor or session | Which channels bring people to the public site? |
| User product analytics | Individual user | Which users completed this workflow? |
| Account-centric analytics | Account with contributing users | Which customers adopted, and how is usage distributed inside them? |
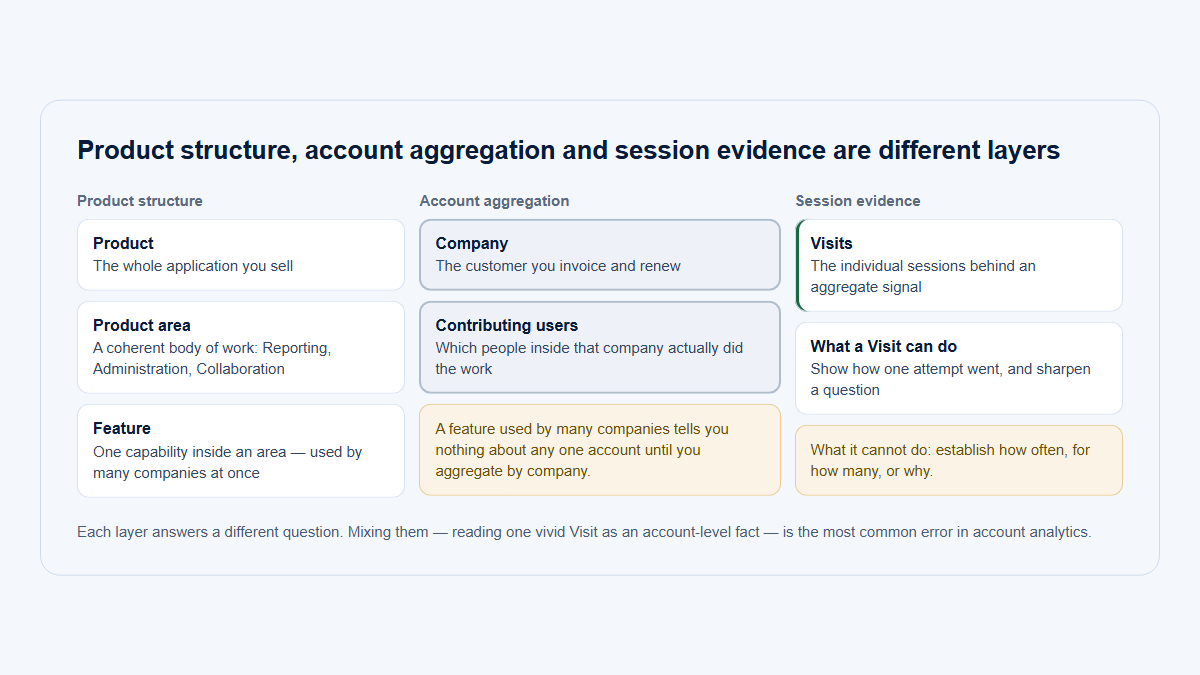
The views can coexist. The mistake is expecting a user total to answer an account question. One hundred Reporting users could represent one large customer, ten broadly adopted customers, or many accounts that each depend on one specialist.
Distribution matters
Identical totals, opposite conclusions
Broad distribution
Four accounts, twelve contributors
Events per user (same scale on both sides)
No user above 2 eventsLosing any one person changes little.
Account A6 events
Account B6 events
Account C6 events
Account D6 events
Highly concentrated
One account, effectively one person
Events per user (same scale on both sides)
13 of 24 events from one userIf that person leaves, the account goes quiet.
Account A15 events
Account B3 events
Account C3 events
Account D3 events
Each bar is one user’s event count in the period. Both sides report 12 active users and 24 events — only the distribution tells you which customer is safe.
B2B roles also separate product use from the buying decision. An administrator may configure the product, contributors may do daily work, managers may review outputs, and procurement may control renewal. User analytics remains essential because those roles explain the account result.
- Account totals show whether the customer reached a workflow.
- User distribution shows whether use is broad, role-appropriate, or concentrated.
- Product areas show which customer jobs became active.
- Visits provide sequence evidence when a metric needs investigation.
Which entity should be the account?
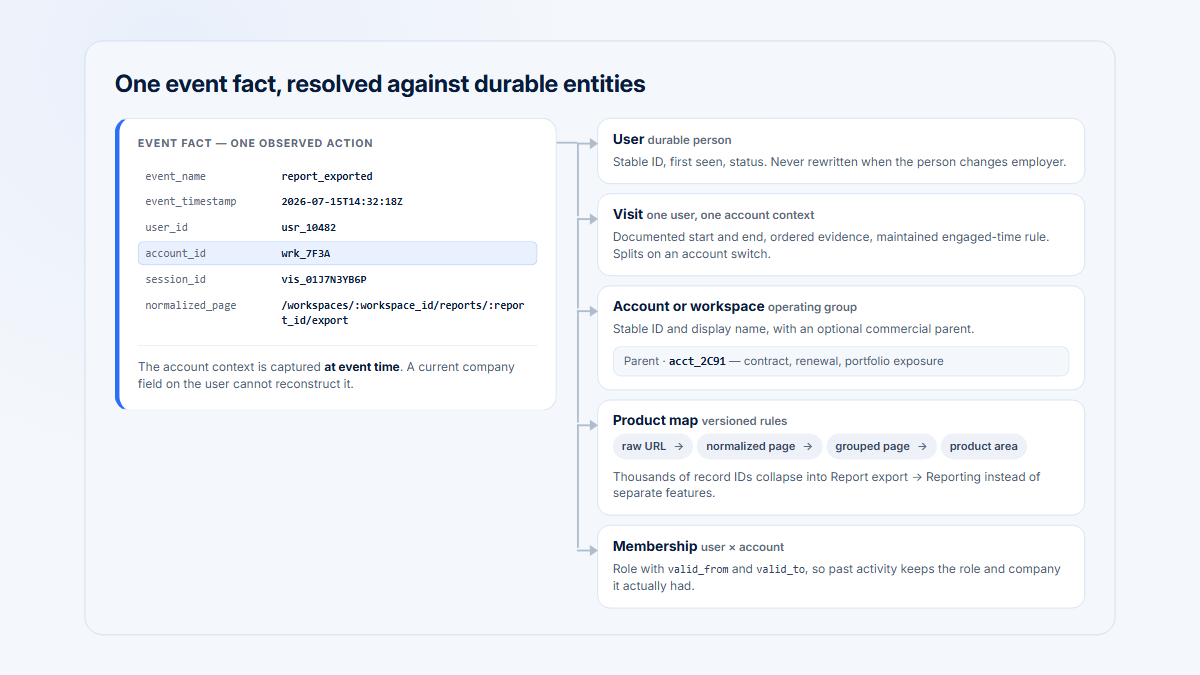
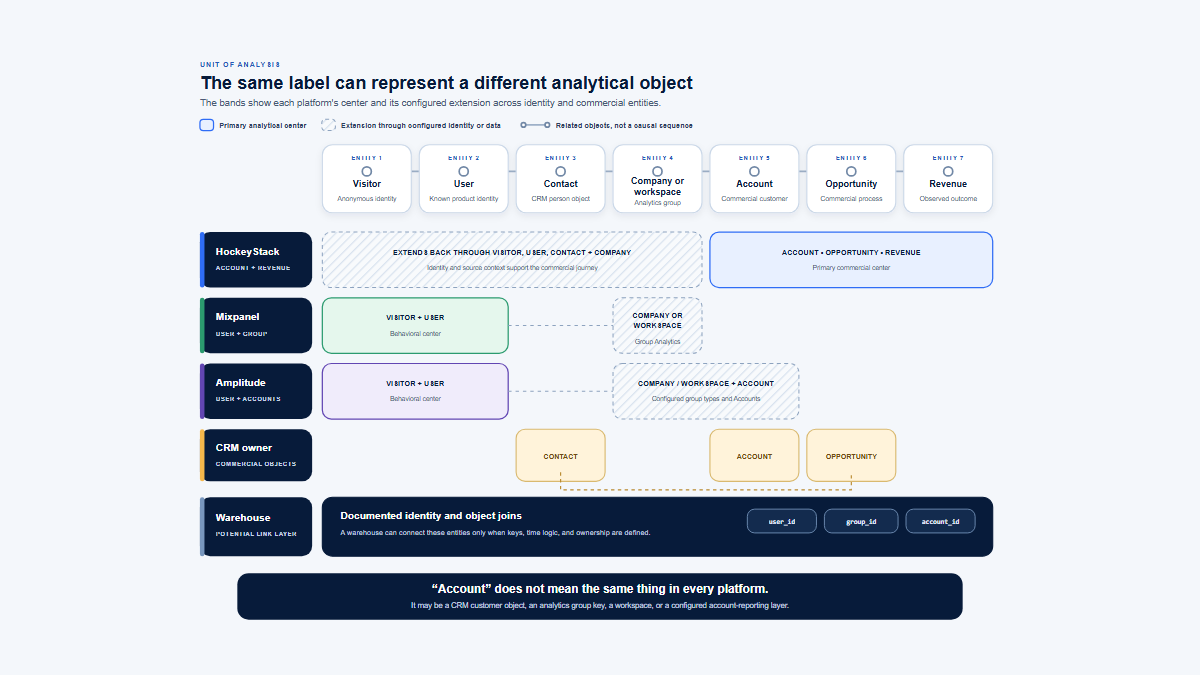
“Account” may mean a company, organization, workspace, team, tenant, subscription, project, or location. Choose the entity that matches the decision.
Some products need both a commercial account and an operating workspace. Preserve both identifiers and attach the active workspace or account to each event. A static user profile is insufficient when one person can switch between several customer environments.
| Layer | Purpose | Minimum useful context |
|---|---|---|
| Account | Commercial and adoption unit | Stable ID, plan, lifecycle, segment |
| User | Person contributing to the result | Stable ID, role, account membership |
| Product area | Meaningful workflow grouping | Grouped feature and normalized page |
| Visit | Sequence and timing context | Session ID, entry, actions, duration definition |
| Event | Observed action or state change | Timestamp, account, user, outcome properties |
Group dynamic URLs into stable product concepts. Keep the raw path for evidence, but use product areas and grouped pages for adoption and trend reporting.
Preserve membership over time
Users can move between teams, workspaces, and customer accounts. Keep event-time membership so historical behavior does not change when a current profile is updated.
Parent-child hierarchies also need an explicit rule. A parent company may renew centrally while child workspaces onboard and adopt independently. Store both when each level supports a real decision.
Which B2B product metrics matter?
Each metric should name its entity, qualifying behavior, eligible denominator, and time window. Do not combine the following signals into one unexplained score.
| Metric | Compact definition | Main question |
|---|---|---|
| Active accounts | Distinct accounts with qualifying activity in the period | How many customers were active? |
| Account adoption | Adopting eligible active accounts ÷ eligible active accounts | How broadly did the capability spread? |
| User penetration | Adopting users ÷ relevant active users inside adopting accounts | How broadly did usage spread within customers? |
| Adoption breadth | Relevant product areas used ÷ relevant areas available | How much of the useful product is adopted? |
| Usage depth | Meaningful actions, recurring use, or successful outputs among adopters | How established is the workflow? |
| Top-user concentration | Top user’s meaningful activity ÷ account total | Does the account depend on one person? |
High concentration is not automatically unhealthy; some products are intentionally specialist-operated. Treat it as a prompt to check role expectations and backup coverage.
Compare equal periods carefully
For counts and totals, percentage change is (current − previous) ÷ previous × 100. For rates, report percentage-point movement. Adoption rising from 40% to 50% is up 10 percentage points.
Keep the entity, qualifying behavior, eligibility rules, and window stable. A new plan mix, changed account membership, or expanded denominator can move the rate even when customer behavior is unchanged.
What does a worked account example reveal?
This fictional Reporting example uses a 30-day window. An account adopts after at least one user completes a meaningful Reporting action.
| Account | Active users | Reporting users | Adopted? | Penetration | Top-user share |
|---|---|---|---|---|---|
| Atlas Labs | 20 | 8 | Yes | 40% | 28% |
| Northstar Works | 10 | 1 | Yes | 10% | 91% |
| Beacon Systems | 12 | 0 | No | 0% | — |
Results
Account adoption is 2 ÷ 3 = 66.7%. User penetration inside adopting accounts is 9 ÷ 30 = 30%.
- Atlas Labs: adoption is distributed across several users.
- Northstar Works: the account qualifies, but one champion produces nearly all activity.
- Beacon Systems: the metric identifies a gap, not whether the cause is fit, access, discovery, or setup.
The example shows why account adoption and internal user distribution belong together. Neither rate proves satisfaction or commercial intent.
Atlas looks more like an established team workflow. Northstar deserves a concentration review: the specialist may be the correct owner, or the account may lack backup coverage. Beacon needs an eligibility and workflow investigation before anyone calls the gap a product failure.
How should you investigate an account signal?
- State the decision. Define what the analysis should change.
- Define meaningful behavior. Use a successful action or state that represents progress.
- Set eligibility and cadence. Include only relevant accounts and a fair opportunity window.
- Inspect the distribution. Compare accounts, segments, product areas, and prior periods.
- Find the contributing users. Check roles, breadth, concentration, and recent changes.
- Review selected visits. Compare successful and unsuccessful sessions from the affected group.
- Act and remeasure. Preserve the original definition so the result remains comparable.
Signal to evidence
Start with a number, open only the evidence it points to
Step 1
Product signal
−38%
Reporting actions, 30 days
Step 2
Affected account
Atlas Labs
8 of 20 users active
Growth plan · renews Q4
Step 3
Contributing users
Avery
Jordan
Nia
Roles and concentration
Step 4
Relevant visits
Failed vs successful session
Chosen by the signal
Step 5
Team action
✓Fix, enable, or wait
Remeasure with the same definition and window.
A signal is not a cause.
Hymetry follows this path through Pages, Companies, Users, and Visits. Product and customer-success teams still decide what the evidence means.
What data must the implementation preserve?
- Stable account and user identifiers rather than mutable names or email addresses.
- Event-time account context for users who can switch workspaces.
- A maintainable hierarchy from product area to grouped feature to normalized raw page.
- Meaningful outcome events alongside page views and exploratory interactions.
- Visit identifiers and clear timing definitions for sequence analysis.
- Account attributes needed for fair segmentation and lifecycle comparisons.
- Privacy controls that minimize capture before sensitive data is stored.
You do not need every possible event before this model becomes useful. Start with stable identity, a maintainable product hierarchy, and a small set of outcome events tied to important decisions.
Autocaptured interactions and page views can support discovery and investigation. Use server-side or otherwise confirmed events when the business outcome requires reliable completion evidence.
| Field | Why it matters |
|---|---|
| Occurred at | Places behavior in the correct period and sequence. |
| Account and user ID | Supports account roll-ups without losing contributors. |
| Visit ID | Connects actions into a reviewable session. |
| Product area and grouped feature | Prevents dynamic paths from fragmenting the workflow. |
| Outcome properties | Separates attempts, failures, and successful completion. |
Filter internal staff, test accounts, service users, and automated activity according to the question. Otherwise technically valid events can create false adoption and engagement.
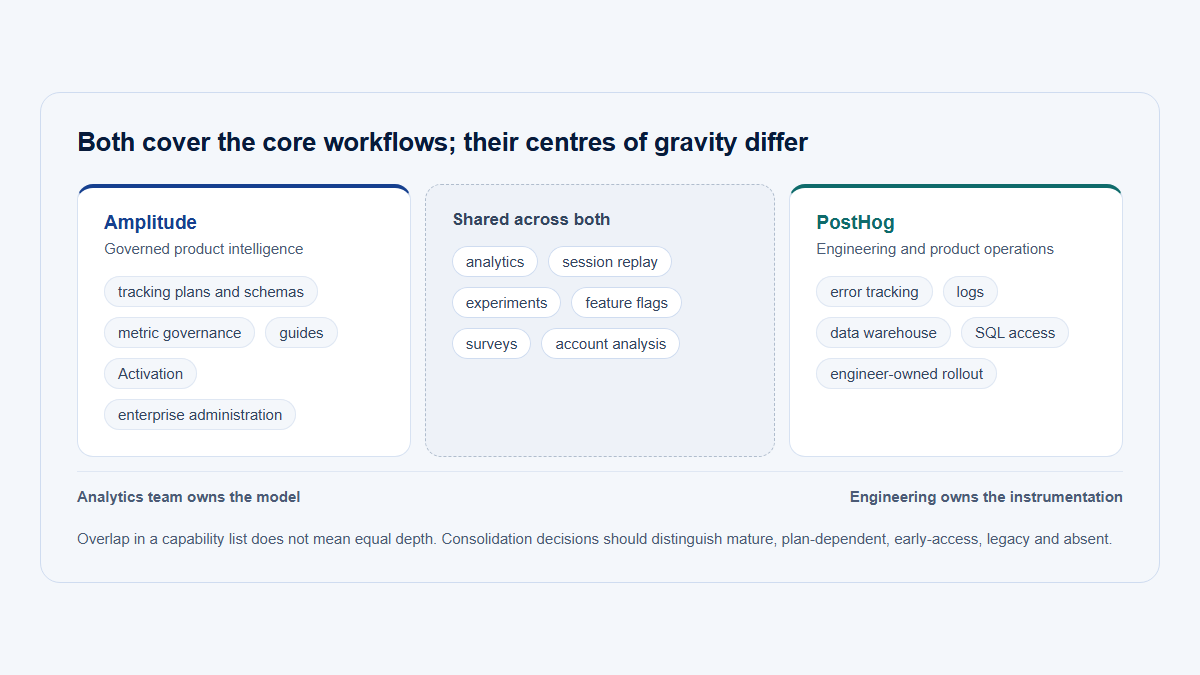
Major analytics platforms expose this model as group or account analytics. See the official documentation for Mixpanel Group Analytics, PostHog Group Analytics, and the Segment Group specification.
Which mistakes distort the result?
| Mistake | Better approach |
|---|---|
| Treating every user as a separate customer | Connect users and events to the relevant account. |
| Including every created account in every denominator | Define active, eligible accounts explicitly. |
| Using logins or page views as proof of value | Track the behavior that represents progress. |
| Looking only at global averages | Inspect segments, distributions, and concentration. |
| Treating usage decline as proof of churn | Use it as an investigation signal alongside customer context. |
| Browsing random session replay | Select visits from a defined account, user, or workflow signal. |
A good metric reduces uncertainty. It does not claim to observe intent, budget, procurement, satisfaction, or every cause of renewal behavior.
The practical conclusion is simple: summarize at the account level, preserve the users and product areas behind the total, and keep detailed session evidence available only when the signal warrants it.
Frequently asked questions
Should the account or user be the primary unit?
Use the account for commercial and customer-level questions. Use users to understand roles, behavior, friction, and who contributed to the account result.
Should the group be a company, workspace, or team?
Use the entity that matches the decision. Products with complex tenancy may need both a commercial account and an operating workspace.
What counts as feature adoption?
Declare the eligible entity, qualifying behavior, and time window. A page visit may measure reach; a completed or repeated workflow is stronger evidence of meaningful adoption.
Can product usage predict churn?
Usage can identify changes worth reviewing, but it does not prove what an account will do. Budget, leadership, procurement, fit, support, and other offline context also matter.
Sources
Methodology
This guide prioritizes official product and data-model documentation. The worked account values are fictional and illustrate interpretation rather than a benchmark.
Source directory
- Hymetry demo Pages view
- Hymetry workflow for product teams
- Hymetry vision for product intelligence
- PostHog: Web analytics versus product analytics
- Mixpanel: Group Analytics
- PostHog: Group analytics
- Twilio Segment: Group specification
- Hymetry: Account-centric product intelligence
- Hymetry Pages
- Hymetry Companies
- Hymetry Users
- Hymetry Visits