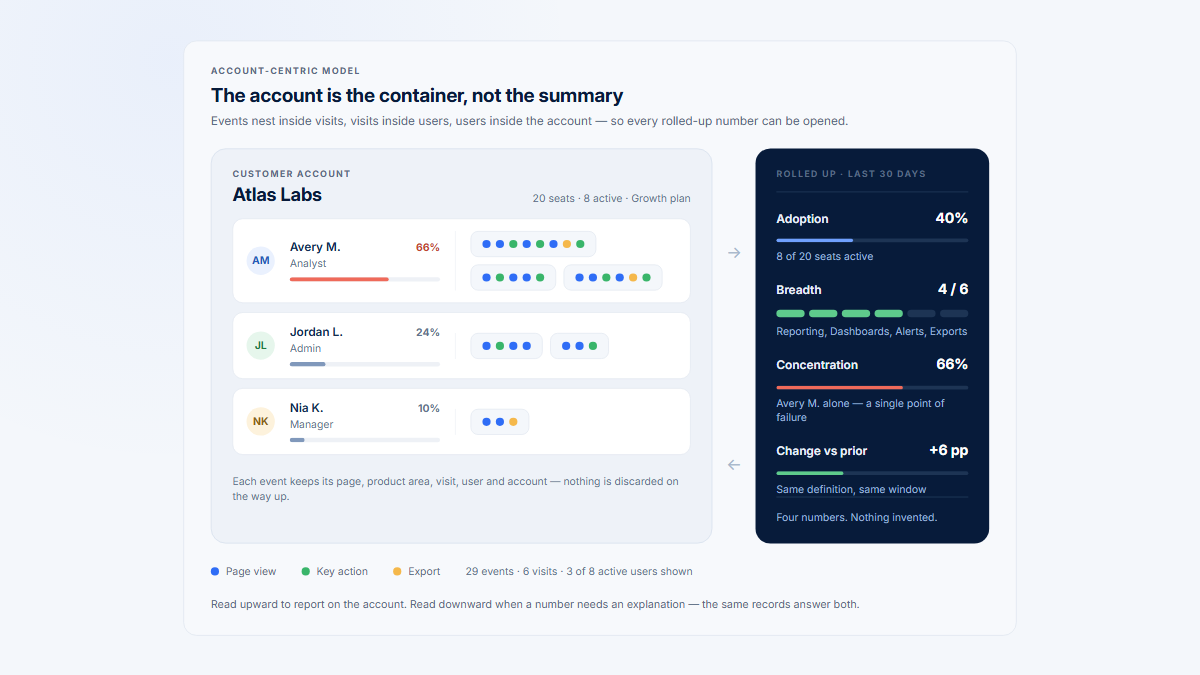
Which company entity should you measure?
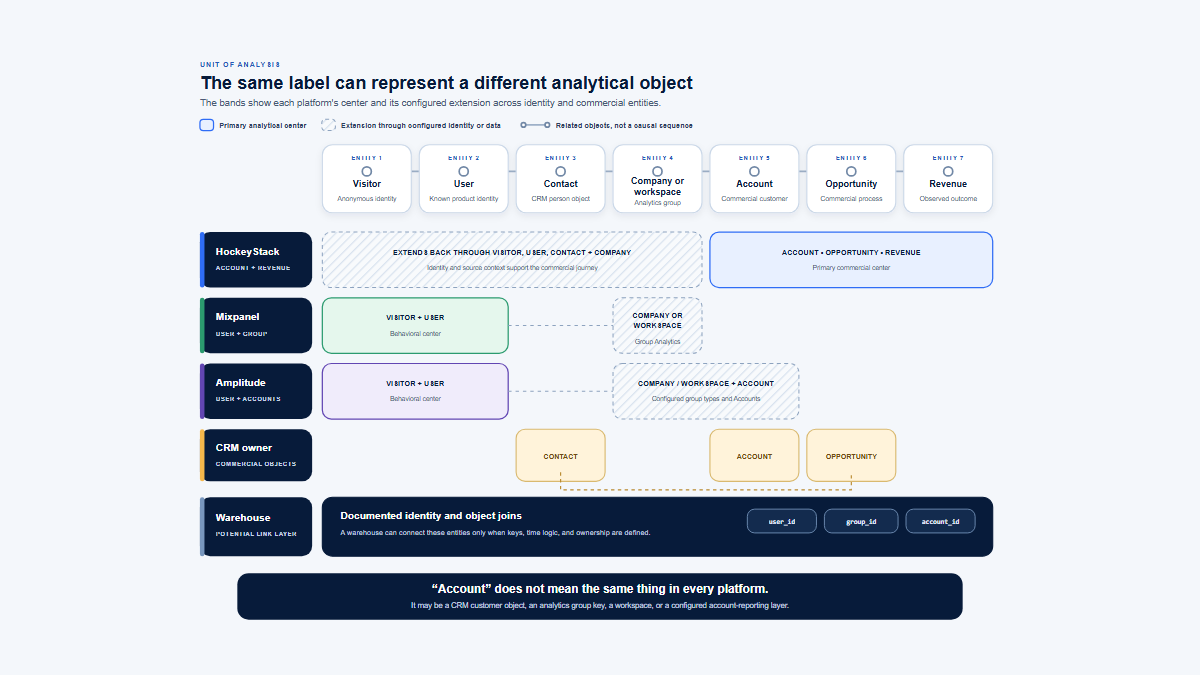
In B2B SaaS, the buyer and the people doing the work live at different grains. Global user or event totals can hide whether activity is distributed across customers or concentrated in one account.
Choose the entity that owns the workflow and decision:
- Commercial company or account for contract, renewal, expansion, and portfolio exposure.
- Workspace, tenant, team, project, or location for the operating context where permissions, data, and work are isolated.
- Both when one commercial account owns several independent operating groups.
Do not force a parent hierarchy into a simple one-workspace product. Conversely, “one of 12 workspaces was active” should not be presented as complete enterprise adoption. Document what signs and pays, where work occurs, whether ownership can change, and how parent-child rollups behave over time.
| Decision | Commercial account view | Operating workspace view |
|---|---|---|
| Portfolio reach | How many buying relationships were active or adopted? | How many independent work contexts were active? |
| Renewal exposure | Roll up relevant workspaces under the contract entity. | Preserve which workspaces contribute or remain inactive. |
| User penetration | Useful only with a defensible cross-workspace eligible population. | Usually clearer when roles and permissions belong to the workspace. |
| Workflow ownership | Can show company-wide dependency. | Reveals the specific team carrying the workflow. |
| Historical change | Needs effective-dated parent ownership. | Needs stable workspace identity through transfers or renames. |
State the grain in every chart title and export. “Active customers,” “active workspaces,” and “active companies with at least one active workspace” answer different questions even when they use the same source events.
What data model keeps company usage traceable?
| Record | Grain | Essential context |
|---|---|---|
| Event | One observed action | ID, name, time, user, active account, Visit, page or feature, properties |
| Visit | One use period by one user in one account context | ID, user, account, start, end, ordered events or stays |
| User | One durable person identity | Stable ID, display attributes, first seen, status |
| Account or workspace | One durable operating group | Stable ID, display name, optional commercial parent |
| Membership | One user-account relationship | User, account, role, valid_from, valid_to |
| Product map | One mapping rule | Raw URL or event, normalized page, grouped feature, area, version |
| Account attributes | Current or effective-dated profile | Plan, size, lifecycle, onboarding, industry, region, use case |
One event fact, resolved against durable entities
Event fact — one observed action
- event_name
- report_exported
- event_timestamp
- 2026-07-15T14:32:18Z
- user_id
- usr_10482
- account_id
- wrk_7F3A
- session_id
- vis_01J7N3YB6P
- normalized_page
- /workspaces/:workspace_id/reports/:report_id/export
The account context is captured at event time. A current company field on the user cannot reconstruct it.
User durable person
Stable ID, first seen, status. Never rewritten when the person changes employer.
Visit one user, one account context
Documented start and end, ordered evidence, maintained engaged-time rule. Splits on an account switch.
Account or workspace operating group
Stable ID and display name, with an optional commercial parent.
Parent · acct_2C91 — contract, renewal, portfolio exposure
Product map versioned rules
Thousands of record IDs collapse into Report export → Reporting instead of separate features.
Membership user × account
Role with valid_from and valid_to, so past activity keeps the role and company it actually had.
{
  "event_id": "evt_01J7N4Q8K2",
  "event_name": "report_exported",
  "event_timestamp": "2026-07-15T14:32:18Z",
  "user_id": "usr_10482",
  "account_id": "wrk_7F3A",
  "commercial_account_id": "acct_2C91",
  "session_id": "vis_01J7N3YB6P",
  "normalized_page": "/workspaces/:workspace_id/reports/:report_id/export",
  "grouped_page": "Report export",
  "product_area": "Reporting",
  "properties": { "format": "csv", "user_role": "analyst" }
}
The active account_id is non-negotiable. A current company field on the user cannot reconstruct activity for consultants, agencies, multi-workspace users, or people who change employers. Keep one stable person, explicit memberships, and event-time account context.
Define a deterministic attribution order rather than filling missing accounts opportunistically:
| Available evidence | Treatment | Audit field |
|---|---|---|
| Trusted event-time account and valid membership | Use the event context. | attribution_source=event |
| Event account missing; trusted Visit contains one context | Enrich under a documented rule. | attribution_source=visit |
| Event account missing; one valid effective-dated membership | Optionally enrich when product behavior makes the context unambiguous. | attribution_source=membership |
| Several valid memberships and no active context | Leave unknown or quarantine. | attribution_source=unresolved |
| Only current profile, email domain, or IP suggests an account | Do not silently assign historical activity. | Retain the candidate mapping for review only. |
Measure the share of valid customer events by attribution source. A rising visit-derived or unresolved share can reveal a tracker regression even when aggregate company totals still look plausible.
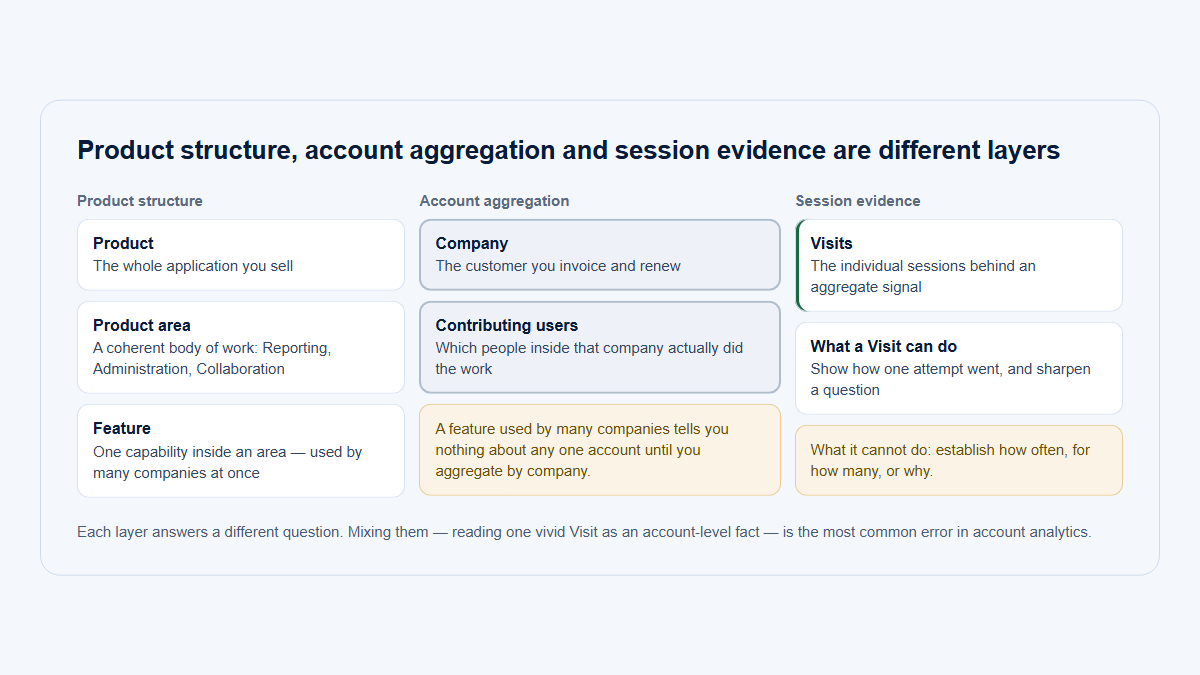
How should product structure and Visits be organized?
raw URL or event
→ normalized page
→ grouped page or feature
→ product area
For example, record-specific task URLs normalize to /workspaces/:workspace_id/projects/:project_id/tasks/:task_id, group into Task details, and roll into Project management. This prevents thousands of IDs from masquerading as separate features.
How do behavior and Visits complete the map?
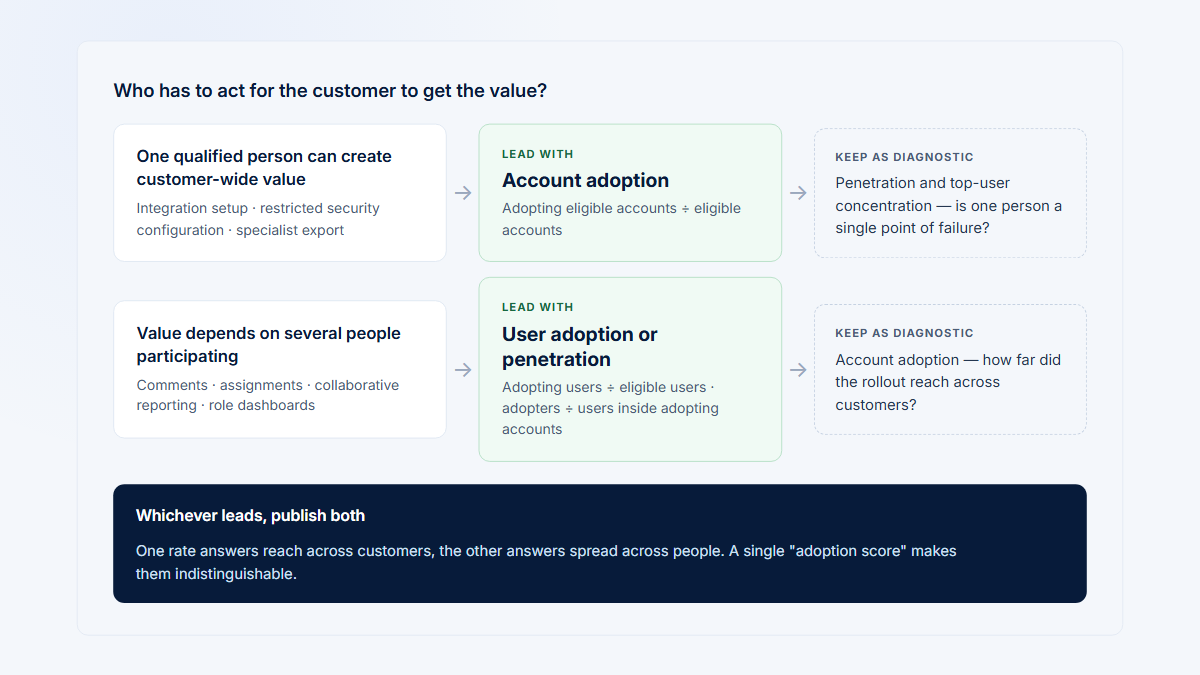
Page discovery, filtering, saving, exporting, and scheduling represent different stages. Define the smallest behavior that matches the question; do not label every click or page open as feature adoption. The feature adoption rate guide covers thresholds and denominators, while account versus user adoption covers analytical grain.
Events say that an action happened. A Visit supplies order, account-switch boundaries, elapsed and observed active-time context, and a direct path to the session worth inspecting. A Visit should have one user, one active account context, a documented start and end, ordered evidence, and a maintained engaged-time rule.
How do you implement company-level analytics?
- Define the account entity. Record the commercial and operating grains and their rollups.
- Establish stable IDs. Document users, accounts, anonymous identity, memberships, merges, splits, logout, and shared-device behavior.
- Attach event-time account context. Add a Visit ID, timestamp, and optional commercial parent.
- Normalize the product map. Version raw-to-normalized-to-grouped-to-area rules.
- Define meaningful events. Prefer clear outcomes such as
project_created,report_saved, orintegration_connected. - Build Visits. Use a supplied ID or documented boundary, and split account switches.
- Aggregate multiple grains. Maintain account, account-user, account-feature, account-area, period, and Visit summaries.
- Add effective-dated attributes. Join plan, size, lifecycle, onboarding, region, and use case.
- Validate against raw evidence. Trace sample summaries to events, membership, pages, sequence, and available replay.
- Exclude invalid actors and environments. Make staff, support, demo, bot, service, staging, and test rules visible.
- Monitor quality. Alert on missing IDs, impossible memberships, unsplit switches, unknown pages, duplicates, late events, and internal leakage.
A maintained pipeline, not one group-by query
1
Raw events
2
Identity and membership
3
Product map
4
Visits
5
Period aggregation
6
Company overview
Watched at every stage
Each stage stamps its rule version on what it writes, so a later mapping or identity change cannot silently rewrite last quarter’s numbers.
| Control | Expected result | Problem caught |
|---|---|---|
| Switch workspace during one browser session. | Subsequent events use the new account and the Visit splits when required. | Cross-account blending |
| Move a user to a new employer. | Earlier activity remains with the old company. | Current-profile rewriting |
| Open two record-specific URLs. | Raw URLs differ while normalized page and grouped feature align. | Artificial product breadth |
| Impersonate a customer for support. | The event stays auditable but does not count as customer usage. | Internal activity leakage |
| Query overlapping daily active companies. | The complete-period distinct total deduplicates the overlap. | Summed-unique inflation |
| Send a duplicate or late event. | The correction and cutoff policy produces a reproducible aggregate. | Unstable published totals |
Run these controls after identity, router, account-switching, product-map, and tracker releases. For production monitoring, publish null-account rate, unknown-page rate, duplicate rate, late-arrival rate, excluded-actor share, and the count of impossible membership joins.
Which company-usage metrics should you report?
| Metric | Definition or formula | Interpretation limit |
|---|---|---|
| Active companies | COUNT(DISTINCT account_id) with a valid Visit in the period | Presence, not meaningful adoption. |
| Active users per company | Distinct valid users grouped by account | Needs role and eligibility context. |
| Visits | COUNT(DISTINCT session_id) | Depends on sessionization. |
| Engaged time | Sum valid observed active intervals | Document idle handling and caps; not proof of value. |
| Meaningful actions | Count vetted events in the documented taxonomy | Different actions need coherent meaning. |
| Adoption breadth | Adopted relevant areas, optionally divided by eligible areas | Raw page coverage inflates it. |
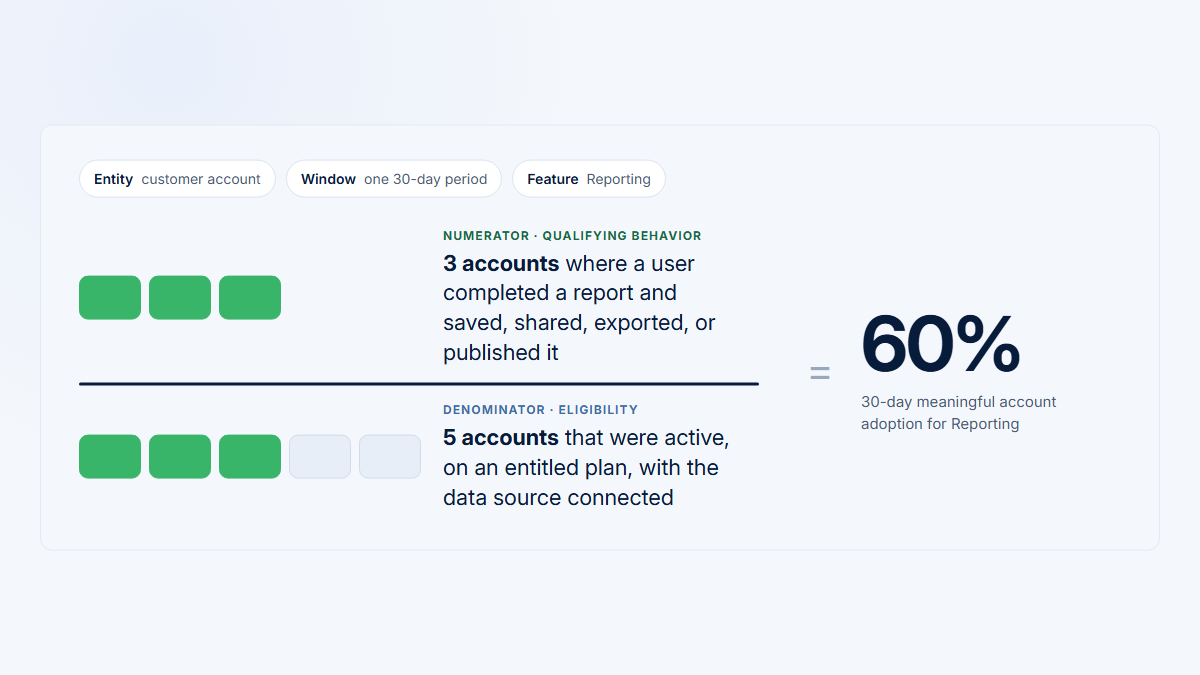
| Feature adoption | Adopting eligible companies / eligible active companies | Needs behavior, denominator, and window. |
| User penetration | Adopting users / eligible active users in the account | Low penetration can be correct for specialists. |
| Consistency | Active days / possible days or expected opportunities | Cadence determines the denominator. |
| Recency | Period end or current time minus latest valid activity | Low-frequency workflows require longer expectations. |
| Period change | Absolute or (current - previous) / previous | Handle zero baseline and equal periods explicitly. |
| Top-user concentration | Largest user action, Visit, or time total / account total | The metric and role model determine meaning. |
| New / dropped areas | Current set minus prior / prior set minus current | Taxonomy and eligibility changes can create false movement. |
No one metric is customer health. Pair totals with distribution, recurrence, completion, account lifecycle, and evidence outside product analytics.
| Layer | Minimum fields | Decision supported |
|---|---|---|
| Portfolio | Eligible and active companies, adoption distribution, peer cohorts, and trend | Where is reach or movement concentrated? |
| Company overview | Users, Visits, active days, areas, meaningful actions, time, concentration, and comparison | Which dimension changed for this account? |
| Area or workflow | Threshold, adopters, completions, recurrence, contributors, and failure states | What work is adopted, shallow, blocked, or dropped? |
| User distribution | Roles, eligibility, active periods, meaningful actions, and account share | Who carries or consumes the workflow? |
| Visit evidence | Ordered pages, actions, outcomes, errors, and maintained time measures | Which sessions can explain the aggregate pattern? |
Each layer should link downward. A portfolio flag with no company list, or a company score with no people, areas, and Visits behind it, turns analytics into an opaque label.
What does the worked portfolio example reveal?
All companies and numbers are fictional. Both portfolios contain four companies, 40 users, 400 Visits, 1,200 meaningful actions, 60 engaged hours, and four global product areas.
| Portfolio A company | Users / Visits / actions / hours | Days | Areas | Top user |
|---|---|---|---|---|
| Oakstone | 10 / 100 / 300 / 15 | 26 | Core, Projects, Reporting, Integrations | 22% |
| Blue Harbor | 10 / 100 / 300 / 15 | 24 | All four | 24% |
| Cedarline | 10 / 100 / 300 / 15 | 23 | Core, Projects, Reporting | 25% |
| Northstar | 10 / 100 / 300 / 15 | 25 | Core, Projects, Integrations | 23% |
| Portfolio B company | Users / Visits / actions / hours | Days | Areas | Top user |
|---|---|---|---|---|
| TitanWorks | 28 / 310 / 930 / 45 | 30 | All four | 18% |
| BrightPath | 7 / 55 / 165 / 9 | 12 | Core, Projects, Reporting | 52% |
| Pine Labs | 4 / 30 / 90 / 5 | 7 | Core, Projects | 74% |
| DeltaOps | 1 / 5 / 15 / 1 | 3 | Core | 100% |
Portfolio A distributes work evenly. Portfolio B's global totals describe TitanWorks far more than a typical company; smaller accounts are narrower, less consistent, and more concentrated. Neither table proves value or churn, but the company grain reveals where to investigate.
Portfolio B makes the distortion concrete. TitanWorks contributes 77.5% of Visits and actions, 75% of engaged hours, and 70% of active users. A global increase caused by TitanWorks can coexist with deterioration in BrightPath, Pine Labs, and DeltaOps. Unweighted account distributions and named company rows prevent the largest customer from speaking for the portfolio.
Illustrative: Pine Labs is active in aggregate, narrow underneath
Pine Labs
4
active users
30
Visits
90
meaningful actions
5h
engaged time
Active days 7 of 30
Intermittent, not weekly. Ask whether the cadence matches the workflow before calling it decline.
Adopted areas 2 of 4 eligible
Two areas never observed. Separate “not eligible” from “not adopted” before acting.
Who did the 90 actions top user 74%
Lead operator admin
Operator 2 member
Operator 3 member
Viewer read-only
One person carries the account. Specialist ownership may be correct — continuity still needs a named backup.
Next question is not whether 90 actions is good. Check which two areas qualified, whether seven active days match this customer’s cadence, whether the other three users did role-appropriate work, then compare an equal prior period and relevant peers.
A company overview should show the selected period and comparison, account attributes, active users, Visits, active days, meaningful actions, engaged time, adopted areas, feature status, concentration, user distribution, recent movement, and links to source users, pages, and Visits.
For Pine Labs, the next question is not whether 90 actions are “good.” Inspect which two areas qualified, whether seven active days match its cadence, whether the top user completed 66 or 67 of the 90 actions implied by a rounded 74% share, and whether the other three users completed role-appropriate work. Then compare an equal prior period and relevant peers.
| Company | Initial pattern | Inspect next |
|---|---|---|
| TitanWorks | High scale, broad use, low leading-user share | Role distribution, completion, outcomes, and whether volume reflects workload |
| BrightPath | Moderate activity with 52% concentration | Second contributor, expected roles, and period trend |
| Pine Labs | Narrow, intermittent, and 74% concentrated | Lifecycle, eligible areas, cadence, ownership, and blocked attempts |
| DeltaOps | One user, one area, three active days | Specialist fit, onboarding, eligibility, and whether more participants are expected |
How do you compare periods and protect data quality?
Compare accounts with relevant plan, size, lifecycle, use case, region, account age, and opportunity. A universal benchmark can punish onboarding, specialist, or low-frequency customers.
- Calculate complete-period distinct users and companies; do not sum daily uniques.
- Use equal completed periods and report percentage-point change for rates.
- Handle a zero prior baseline as new activity, not infinite growth.
- Match the window to expected cadence and expose timezone and period boundaries.
- Version product mappings, eligibility rules, and identity corrections.
- Monitor excluded traffic and null context so filters do not hide real customers.
Which data-quality controls belong in every review?
- Change control: log identity rules, hierarchy, product mappings, meaningful-event taxonomy, session boundaries, eligibility, exclusions, peer cohorts, and privacy processing. Store the rule version on derived tables.
- Reconciliation: trace valid events to Visits, users, accounts, grouped pages, areas, account-user totals, company totals, and portfolio totals. Resolve unexplained residuals before publication.
- Data minimization: prefer stable pseudonymous IDs, controlled event properties, retention limits, access controls, and explicit redaction or masking. Exclude sensitive values, tokens, secrets, and unnecessary content.
How does Hymetry support company investigation?
Hymetry connects Companies, Pages, Users, and Visits. Start with an account summary, isolate the changed product area or grouped page, inspect the contributing people and concentration, then open relevant session evidence.
How should you use the company drill-down?
Grouped pages provide a stable analytical level while normalized raw pages retain exact evidence. Aggregate signals should select the Visits worth reviewing instead of encouraging random replay browsing. Hymetry does not automatically know intent or causality and does not guarantee churn prediction.
The implementation foundation is covered in the company and user modeling guide and the broader B2B product analytics guide.
- Begin with the question. Reach starts with eligible and adopting companies; health investigation starts with completion, recurrence, distribution, and trend; rollout starts with workspaces, roles, and penetration.
- End with a falsifiable next step. Validate instrumentation or eligibility, inspect the changed workflow, confirm ownership, improve onboarding, or monitor the next expected cycle. Record what would overturn the explanation.
- Make operational triggers reproducible. Store the metric version, account grain, peer cohort, period, component reasons, and source links so later rule changes do not rewrite earlier decisions.
- Close the evidence loop. After the next expected workflow cycle, compare the observed result with the recorded explanation. Keep confirmed, overturned, and still-unknown outcomes so recurring review rules improve instead of repeating the same unsupported assumption. Make that follow-up visible to later reviewers.
Frequently asked questions
What is account-level product usage?
Valid product behavior aggregated by a stable company or operating group while preserving users, Visits, features, and areas behind the total.
Should account ID live on the user or event?
Use an explicit membership plus event-time account context; a current user profile alone is insufficient.
How should one user in several companies work?
Maintain many-to-many memberships and attach the active account to every event, splitting Visit attribution on context change.
What counts as an active company?
A defensible baseline is an eligible company with at least one valid product Visit during the selected period.
Do company analytics require sessions?
Not for basic counts, but Visits add sequence, context boundaries, time evidence, and a path to investigation.
What is a good top-user concentration?
No universal threshold exists; interpret company size, roles, eligible users, history, peers, and the underlying activity metric.
Does more engaged time mean more value?
No. It is observed active product time and needs outcomes, breadth, participation, cadence, and session context.
Sources
Methodology and limitations
First-party documentation supports identity, groups, sessions, account reporting, and tracking design. The processing framework, fictional portfolio, calculations, and visuals are original. Company usage is behavioral evidence, not automatic customer intent or value.
Source directory
- Hymetry demo Companies view
- Hymetry workflow for customer-success teams
- Twilio Segment Group specification
- Twilio Segment Identify specification
- Twilio Segment Track specification
- Twilio Segment identity best practices
- PostHog group analytics
- PostHog sessions
- PostHog user identification
- Mixpanel group analytics
- Mixpanel events and properties
- Mixpanel data-model concepts
- Mixpanel sessions
- Mixpanel identity merge
- Pendo ID and metadata guidance
- Pendo Account ID guidance
- Pendo parent-account configuration
- Amplitude account-level reporting
- Amplitude account instrumentation
- Amplitude user identification
- Amplitude session tracking
- Snowplow entities
- Snowplow tracking-design best practices
- Snowplow identifiers
- European Data Protection Board basics
- EU General Data Protection Regulation
- OWASP Logging Cheat Sheet