How do you calculate feature adoption rate?
Feature adoption rate is the percentage of eligible active accounts or users that meet a predefined behavior threshold during a stated window. The arithmetic is simple; the operational definition determines whether the result is useful.
General formula
Distinct eligible entities that meet the adoption threshold ÷ distinct eligible entities with an opportunity to adopt × 100
| Component | Question to answer | Reporting example |
|---|---|---|
| Entity | Are you measuring accounts, users, or another unit? | Customer account |
| Eligibility | Who had access, permission, prerequisites, need, and opportunity? | Active accounts on an eligible plan with a connected data source |
| Qualifying behavior | What action or state represents adoption? | A user completes and saves, shares, exports, or publishes a report |
| Window | How long does an eligible entity have to act? | 30 days |
A reproducible definition is: “An eligible active account adopts Reporting when at least one permitted user completes a report and saves, shares, exports, or publishes the output during a 30-day window.”
Numerator · qualifying behavior
3 accounts where a user completed a report and saved, shared, exported, or published it
Denominator · eligibility
5 accounts that were active, on an entitled plan, with the data source connected
60%
30-day meaningful account adoption for Reporting
The rate measures breadth across a population. It does not measure total event volume, satisfaction, business impact, or how deeply each adopter uses the feature.
- Count each account or user once in the numerator.
- Ensure every adopter is also eligible for the denominator.
- Evaluate eligibility and behavior with compatible time rules.
- Define the metric before viewing the result.
Which stage of adoption are you measuring?
“Feature adoption” is often used for several different signals. Report each for what it proves rather than forcing them into one label.
| Signal | Definition | Useful question | Does not establish |
|---|---|---|---|
| Discovery | The entity reaches the feature or entry point. | Did the audience find it? | Useful task completion |
| First use | The first qualifying interaction occurs. | Did discovery produce an attempt? | Recurring workflow adoption |
| Meaningful use | A declared value-bearing action or state completes. | Did use progress beyond entry? | Satisfaction or business impact |
| Repeated use | The threshold occurs in several required sessions or periods. | Did use extend beyond one trial? | Long-term retention |
| Feature retention | Initial adopters return in later opportunity periods. | Does qualifying behavior persist? | Why users returned |
| Depth | Frequency, complexity, or range among adopters. | How much are adopters doing? | Breadth across the eligible population |
A page open can be a valid discovery or grouped-page usage metric. It is not automatically meaningful adoption when the workflow requires a successful output.
These stages do not always form a strict funnel. Meaningful use can occur on a first visit, repeated behavior can remain superficial, and an adopter can complete the workflow once without returning when no later opportunity occurs.
When the qualifying behavior is a sequence, specify whether every step must occur in one Visit, whether order matters, and whether a server-side confirmation is required. When it is a state, record when the state became true and which account or user receives credit.
Passive consumption needs a narrow definition. A rendered report can show availability or reach, while a confirmed view with suitable activity may be stronger evidence. It still does not prove attention or value.
Should you measure accounts, users, or penetration?
| Metric | Formula | Question answered |
|---|---|---|
| Account adoption | Adopting eligible active accounts ÷ eligible active accounts | How broadly did the feature spread across customers? |
| User adoption | Adopting eligible active users ÷ eligible active users | How broadly did it spread across relevant people? |
| User penetration | Adopting users ÷ relevant active users inside adopting accounts | How broad is usage after an account adopts? |
| Repeated-use rate | Adopters active in the required periods ÷ initial adopters | Did initial use recur at the expected cadence? |
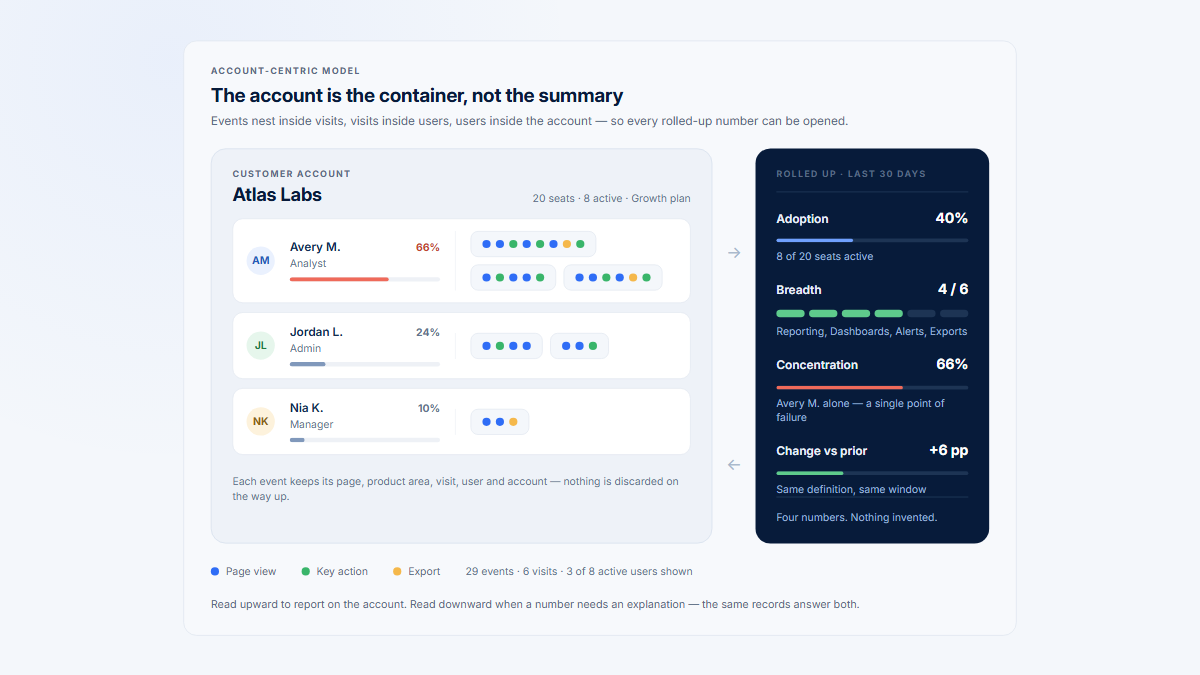
An account counts once whether one or one hundred users qualify. That makes account adoption useful for portfolio reach but capable of hiding champion concentration.
- High account adoption with low penetration may indicate one-person usage.
- Lower account adoption with high penetration may fit a narrower but well-adopted use case.
- For an administrator-owned feature, one qualified user may be enough.
- For a collaborative feature, require multiple participants, roles, or shared outputs when appropriate.
Keep the numerator aligned across related metrics. If account adoption requires meaningful report completion, calculate penetration from users meeting that same threshold rather than users who merely opened the page.
Repeated use also needs an explicit entity and cadence. Distinct days may fit a daily workflow, while monthly reporting needs separate reporting cycles. Do not reuse one retention rule for every feature.
Repeated-use rate
Initial adopters who meet the threshold in the required later periods ÷ initial adopters × 100
A one-time setup feature should use successful configuration and persistence rather than repeated returns to setup. A collaboration workflow may need recurring account use and participation from several relevant users.
How do you choose the denominator, behavior, and window?
| Decision | Include | Exclude or report separately |
|---|---|---|
| Account denominator | Active accounts with entitlement, prerequisites, need, and opportunity | Closed, test, ineligible, unconfigured, or not-yet-ready accounts |
| User denominator | Active users with the relevant role and permission | Invited, deactivated, service, internal, or unauthorized users |
| Behavior | Successful state change or output tied to the decision | Page reach, attempts, and failures unless those are the declared question |
| Window | A complete opportunity period matching natural cadence | Partial cycles or unequal exposure periods |
| New accounts | Equal time since first eligibility or a dedicated onboarding cohort | Immediate comparison with mature customers |
Track prerequisite completion separately when it is a product problem. Excluding unconfigured accounts may make the feature rate fair, but it should not hide a setup bottleneck.
| Behavior | What it indicates | Limitation |
|---|---|---|
| Page viewed | Reach or discovery | No proof of completion |
| Configuration started | Intent and initial progress | May fail before success |
| Meaningful action completed | Declared workflow outcome | No proof of satisfaction or causal value |
| Server-confirmed state | Business outcome completed | May omit the interface path or friction |
| Repeated completion | Recurring use across opportunities | Must match the workflow’s cadence |
Handle eligibility edge cases explicitly
- Entitlements: declare whether access is evaluated at the start, end, or throughout the window.
- Permissions: include users who can perform the qualifying action, not everyone who sees the page.
- Prerequisites: report prerequisite conversion separately when setup is part of the product problem.
- Onboarding: give new accounts equal opportunity time or analyze them as a dedicated cohort.
- Optional use cases: define the relevant cohort with observable attributes, not eventual adoption.
All created accounts may be useful for a cumulative installed-base question, but it is usually a poor denominator for current-period adoption. Active does not automatically mean eligible, and entitlement does not automatically mean realistic opportunity.
Access and opportunity are different
An account can have an eligible plan without encountering the business event that makes a feature relevant. Monthly reporting, renewal configuration, and incident response may need account-period or trigger-based denominators.
If opportunity is not directly captured, use a transparent proxy and state the limitation. Do not use future adoption itself to decide who was eligible.
What does a Reporting example reveal?
This fictional 30-day example is not customer data or a benchmark. The product has eight created accounts, six active accounts, and five active accounts eligible for Reporting.
| Eligible account | Active users | Opened Reporting | Completed meaningful action | Account adopted? |
|---|---|---|---|---|
| Atlas Works | 8 | 5 | 4 | Yes |
| Birch Health | 5 | 3 | 2 | Yes |
| Copperline | 4 | 1 | 1 | Yes, through one champion |
| Delta Freight | 6 | 2 | 0 | No |
| Ember Labs | 2 | 0 | 0 | No |
| Measurement | Calculation | Result |
|---|---|---|
| Account discovery | 4 accounts opened ÷ 5 eligible active accounts | 80% |
| Meaningful account adoption | 3 completing accounts ÷ 5 eligible active accounts | 60% |
| Meaningful user adoption | 7 completing users ÷ 25 eligible active users | 28% |
| Penetration in adopting accounts | 7 completing users ÷ 17 active users in adopters | 41.2% |
| Repeated use | 4 repeat users ÷ 7 initial meaningful adopters | 57.1% |
The 80% reach and 60% meaningful adoption rates are both correct, but they answer different questions. Copperline also shows why one account can qualify while remaining dependent on one champion.
All created accounts
everything that ever signed up
3 ÷ 8
37.5%
Active accounts
2 inactive accounts drop out
3 ÷ 6
50%
Eligible active accounts
1 more lacks the plan or the setup
✓ the rate to publish
3 ÷ 5
60%
- Adopted — the same 3 every time
- Counted, did not adopt
- Removed from the denominator
| Denominator | Calculation | Interpretation |
|---|---|---|
| All eight created accounts | 3 ÷ 8 = 37.5% | Share of the complete created base |
| All six active accounts | 3 ÷ 6 = 50% | Includes one active but ineligible account |
| Five eligible active accounts | 3 ÷ 5 = 60% | Current accounts with access and opportunity |
No calculation contains an arithmetic error. Only the third answers the declared question about current eligible customers. The denominator label is part of the result, not a footnote.
The example still does not establish satisfaction, report quality, causal business impact, retention, or equal value across adopters. Those claims require different evidence.
Interpret the gaps separately
- Delta Freight: users reached Reporting but did not complete the declared action, so inspect workflow progress and failure evidence.
- Ember Labs: no discovery occurred, so check opportunity, visibility, role, and relevance before changing completion UX.
- Copperline: the account adopted through one user, so check whether specialist ownership is expected or fragile.
- Atlas Works and Birch Health: several users completed the workflow, but the rate still does not prove outcome quality.
Suppose four of seven initial meaningful users complete Reporting in at least two distinct weeks. The repeated-use rate is 4 ÷ 7 = 57.1%. It concerns repetition among initial adopters, not long-term retention across all eligible users.
What is a good feature adoption rate?
There is no universal percentage. A defensible expectation depends on the audience, workflow importance, role ownership, maturity, cadence, lifecycle, and denominator quality.
| Context | Interpretation |
|---|---|
| Core versus optional | A core workflow should reach a broader eligible audience than a specialist capability. |
| Administrator-owned versus collaborative | One user may be enough for setup but too weak for collaboration. |
| New versus mature | Use exposure-based cohorts or compare similar feature age. |
| Daily versus low-frequency | Repeated use must match the natural opportunity cycle. |
| Global versus relevant peer group | Compare equivalent plans, roles, lifecycle stages, and prerequisites. |
A “good” rate is correctly defined, meets a declared expectation for the relevant cohort, distributes appropriately across accounts and users, and uses a behavior that represents the intended workflow. Adoption alone is not proof of customer value.
- Set an expectation from the feature’s intended audience and job.
- Use the same definition for the target and observed result.
- Show account distribution and user concentration beside the global rate.
- Review discovery and completion separately before choosing an intervention.
For a core workflow, a low rate may indicate discovery, setup, fit, or completion problems. For an optional specialist workflow, low global reach can be healthy when the relevant segment adopts and repeats it.
When comparing periods, keep the definition stable and show raw counts. Adoption moving from 40% to 50% is up 10 percentage points, or 25% relative to the 40% baseline.
Separate behavior from denominator movement
A rate can change because more accounts gained an eligible plan, onboarding accounts entered the cohort, permissions changed, prerequisites improved, or inactive customers left the denominator.
Show numerator and denominator counts beside the rate. Version changes to events, identity rules, exclusions, and thresholds rather than splicing incompatible definitions into one trend.
- Compare the same feature with its preceding equivalent period.
- Use matched release or onboarding cohorts with equal exposure.
- Compare accounts with similar plans, lifecycle, use cases, and prerequisites.
- Avoid external benchmarks whose entity, event, denominator, or window differs.
A newly launched feature is usually clearer in exposure-based cohorts. Give each account the same number of days after eligibility instead of comparing one account with 30 days of opportunity and another with two.
How should you define and maintain the metric?
- State the decision. Explain what the metric should change.
- Choose the entity. Use account or user consistently on both sides of the ratio.
- Define eligibility. Record access, roles, prerequisites, lifecycle, activity, exclusions, and minimum opportunity.
- Define meaningful behavior. Name the exact event, successful state, sequence, or account roll-up.
- Select the window. Match natural cadence and complete opportunity cycles.
- Choose first or repeated use. Do not apply recurring retention to one-time setup.
- Inspect account distribution. Check concentration, role gaps, and large-account dominance.
- Validate and version. Confirm events with real evidence and preserve definition changes.
Keep a short metric specification
- Metric name and product decision
- Entity, numerator, and denominator
- Qualifying event, state, sequence, or account roll-up
- Window and repeated-use rule
- Eligibility, exclusions, identity, and deduplication rules
- Segments, owner, and definition version
| Mistake | Why it fails |
|---|---|
| Counting every account | Inactive, test, ineligible, or unconfigured accounts dilute current adoption. |
| Treating page reach as value | Entry does not show that the workflow completed. |
| Mixing account and user entities | The numerator and denominator no longer describe one population. |
| Changing thresholds after seeing results | Post-hoc rules prevent reproducible comparison. |
| Ignoring concentration | Large accounts or one champion can dominate the total. |
| Using a short window for a rare workflow | Eligible entities may not receive a fair opportunity. |
| Ignoring event and identity quality | Retries, service accounts, duplicates, and missing account joins distort both sides. |
Validate the instrumentation
- Confirm that a qualifying event fires only after successful completion.
- Deduplicate retries, imports, and repeated client delivery.
- Filter internal, test, service, and automated users where appropriate.
- Preserve the account active at event time for multi-workspace users.
- Review selected successful and failed Visits to test the event’s meaning.
A dashboard cannot repair an ambiguous event after calculation. Validate the tracked behavior before turning it into a target or release decision.
- Test successful, failed, repeated, and ineligible cases.
- Confirm that the account and user joins match the active context.
Use a precise visible name such as “30-day meaningful account adoption for Reporting.” A generic dashboard label encourages readers to forget the entity, behavior, and window.
When a feature changes materially, verify that the old and new events still describe the same behavior. If not, start a new versioned series or backfill only when the revised definition can be applied consistently.
Hymetry’s Pages groups raw paths into product areas, while Companies and Visits connect the rate to account distribution and selected session evidence. The demo Pages view shows the current model.
Frequently asked questions
Does opening a feature count as adoption?
It can count for a reach or grouped-page usage metric. When value requires completion, report the successful workflow separately as meaningful adoption.
Should B2B SaaS measure account or user adoption?
Use account adoption for spread across customers, user adoption for spread across relevant people, and penetration for spread inside adopting accounts.
How often should adoption be measured?
Use a window that fits the natural workflow. New releases are often clearer when each account receives equal time from first eligibility.
Can daily unique users be summed for a monthly total?
No. Deduplicate the entity across the complete month or selected period.
What is the difference between adoption and penetration?
Account adoption measures the share of eligible accounts meeting the threshold. Penetration measures the share of relevant users participating inside the accounts that adopted.
Sources
Methodology
Sources were reviewed on 3 August 2026. Official documentation and primary research were prioritized. Vendor educational pages support definitions and implementation examples, not universal benchmark claims. The worked example is fictional.
Source directory
- Google Research: User-centered metrics for web applications
- Contentsquare: Feature adoption framework
- Metabase: Feature adoption rate
- Pendo: Data Explorer reports
- Pendo: Retention by first use
- Amplitude: Analytics definitions
- Amplitude: Time in retention analysis
- Eurostat: Percentage change and percentage points
- PostgreSQL: Aggregate expressions
- Hymetry Pages
- Hymetry Companies
- Hymetry Visits
- Hymetry for product teams
- Hymetry demo Pages view