What should a customer health score represent?
A customer health score is a numeric score, category, or status that summarizes selected evidence about an account. Its useful purpose is operational: help a team scan a portfolio, notice changes, and decide which account or component deserves review.
| Concept | What it represents | Do not confuse it with |
|---|---|---|
| Product-usage health | Observed adoption, activity, distribution, trend, and friction | Complete customer health or intent |
| Overall customer health | Usage plus relationship, support, commercial, outcome, and sentiment evidence | An objective fact with one cause |
| Churn prediction model | A model trained for a defined future outcome and horizon | An unvalidated weighted score |
| Prioritization signal | A rule or score that directs limited review time | Proof that an account will churn or renew |
A score of 68 does not explain whether the account has an adoption problem, procurement delay, missing champion, or support escalation. Keep those evidence layers visible even when they inform one review.
In the score
Product usage
- Adoption of essential workflows
- Breadth across product areas
- Consistency over expected intervals
- User distribution and concentration
- Trend against an equal prior period
Not observable in events
Relationship
- Champion and sponsor
- Leadership changes
- Stated satisfaction
Not observable in events
Support
- Open escalations
- Ticket history
- Response times
Not observable in events
Commercial
- Plan, seats, invoices
- Procurement and budget
- Renewal timing
Not observable in events
Outcomes
- The customer's own results
- Value review
- Expansion case
Overall account review
The usage score ranks and routes attention. The other four layers decide what the account actually needs.
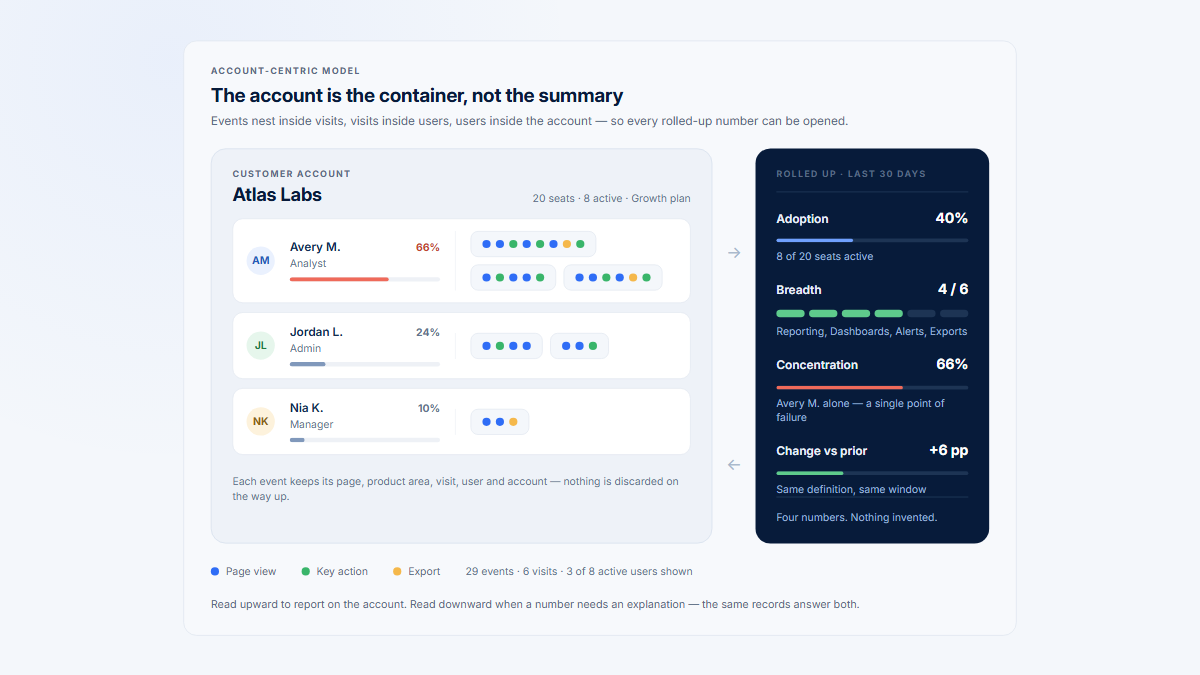
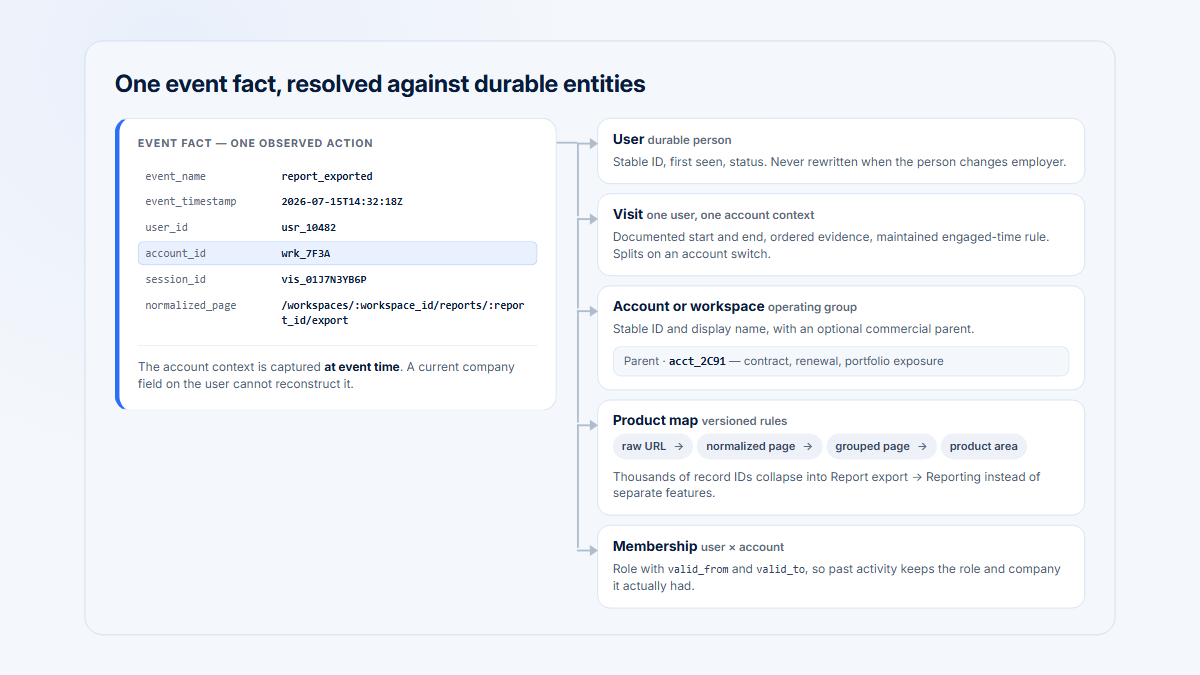
For the account, user, and product structure behind this layer, see B2B product analytics and product usage by company.
Composite indicators compress several dimensions into something easy to scan, but the compression can hide weak components, missing data, and offsetting trade-offs. The OECD composite-indicator handbook recommends making those construction choices explicit.
- Use the score to rank or route reviews.
- Show the components before assigning an account label.
- Keep offline relationship and commercial evidence beside product usage.
- Record the reason a score moved, not only the new total.
A product-usage score can support portfolio reviews, pre-renewal preparation, onboarding checks, and product investigations. The purpose should determine the population, update cadence, evidence path, and owner.
Do not begin with “predict churn” unless the outcome and horizon are defined. A descriptive score can still be useful when it consistently sends reviewers to meaningful account questions.
Which product-usage signals belong in the score?
Start with dimensions that represent the product’s expected workflows. A metric belongs only when its entity, denominator, qualifying behavior, window, direction, and missing-data rule are documented.
| Dimension | What to measure | Important limitation |
|---|---|---|
| Adoption | Eligible essential workflows that reached meaningful use | Exclude irrelevant plans, roles, and use cases. |
| Breadth | Adopted eligible product areas ÷ eligible areas | Specialist customers may need only one area. |
| Depth | Successful outputs, completion, or recurring use among adopters | More time or events can indicate retries or friction. |
| Consistency and recency | Meaningful use across expected intervals | Use the workflow’s natural cadence. |
| User distribution | Role coverage, penetration, and top-user concentration | One administrator may be expected; one champion may also be fragile. |
| Trend | Current value versus an equivalent prior period or baseline | Check seasonality, lifecycle, and denominator changes. |
| Observed friction | Confirmed failures, retries, errors, or incomplete workflows | Capture only signals that reliably represent the problem. |
Not every dimension needs to enter one formula. Depth and friction are often product-specific, so they may work better as visible diagnostics or guardrails than weighted components.
Define the difficult cases before scoring
- Adoption: distinguish a page open from a value-bearing completion and exclude workflows irrelevant to the account.
- Breadth: count only product areas the plan and use case make relevant.
- Depth: prefer successful outputs or task completion to ambiguous time spent.
- Consistency: compare monthly work with monthly opportunities rather than a daily recency rule.
- Distribution: measure participation by expected roles and top-user concentration.
- Trend: compare equal windows and show whether the numerator, denominator, or cohort changed.
- Friction: separate confirmed failures from exploratory activity or long sessions.
One-time setup deserves special treatment. Successful configuration can reduce future interface activity while continuing to create value through automation. Score configuration completion and output health rather than penalizing the account for not returning.
| Component | Illustrative definition |
|---|---|
| Adoption | Weighted adopted essential workflows ÷ weighted eligible workflows |
| Breadth | Adopted eligible product areas ÷ eligible areas |
| Consistency | Expected intervals with meaningful use ÷ intervals observed |
| User penetration | Active eligible users ÷ known eligible users |
| Top-user concentration | Top user’s meaningful activity ÷ account total |
| Trend | Current value compared with an equal prior period |
These definitions are examples. A product should replace them with evidence tied to its own jobs, roles, and opportunity cycles.
How do you build a transparent score?
The following formula is illustrative, not a Hymetry standard or industry benchmark. Assume five components normalized to a 0–100 scale:
Illustrative product-usage health score
Adoption × 25% + Breadth × 20% + Consistency × 20% + User distribution × 15% + Trend × 20%
- Choose the cohort and window. Define lifecycle, plan, use case, size, cadence, and minimum data coverage.
- Specify each component. Record its numerator, denominator, eligibility, window, direction, exclusions, and source events.
- Normalize visibly. Use fixed targets or documented peer baselines and version the bounds.
- Apply documented weights. Explain why each component contributes to the decision.
- Preserve the evidence. Show the raw value, normalized value, weight, prior value, coverage, and reason for movement.
- Add explicit guardrails. Missing identity, severe concentration, or confirmed friction may require review outside the average.
Illustrative normalization
Normalized value = clamp(0, 100, 100 × (observed − lower target) ÷ (upper target − lower target))
Invert the direction for lower-is-better metrics. Do not normalize against changing global minimums and maximums without documenting how that choice alters historical comparability.
Guardrails should remain visible and versioned. For example, missing account identity can block a health label, severe champion concentration can force review, and a confirmed workflow failure can create a separate alert instead of subtracting a few points.
Watch for compensation between components
Strong activity can offset weak user distribution in a weighted average. The arithmetic may produce a healthy score even though a collaborative account depends on one person.
Decide which weaknesses may compensate for each other and which should remain independent flags. Document any override so reviewers can reproduce the final state.
BeaconDesk · 30 days
70.7
of 100 possible points
Four components carry the total. The 15% distribution weight lets one-champion risk hide inside a healthy-looking number.
What does a worked example show?
These four accounts and values are fictional. The score uses the illustrative formula above; it is not customer data or a performance benchmark.
| Account | Lifecycle | Adoption | Breadth | Consistency | Distribution | Trend | Score |
|---|---|---|---|---|---|---|---|
| ArborGrid | Mature | 88 | 90 | 86 | 82 | 78 | 85.1 |
| BeaconDesk | Mature | 82 | 78 | 86 | 25 | 68 | 70.7 |
| CedarOps | Mature | 88 | 82 | 75 | 84 | 25 | 71.0 |
| DeltaPilot | Onboarding | 42 | 35 | 50 | 55 | 88 | 53.4 |
- ArborGrid: balanced adoption, breadth, consistency, and distribution.
- BeaconDesk: good totals hide dependence on one champion.
- CedarOps: broad current use hides a declining trend.
- DeltaPilot: low mature-account scores may be normal during onboarding.
BeaconDesk and CedarOps have almost identical totals but need different investigations. The component pattern, not the final label, tells the team what to inspect.
BeaconDesk calculation
82×25% + 78×20% + 86×20% + 25×15% + 68×20% = 70.7
The low distribution component is more actionable than the 70.7 total. CedarOps reaches a similar total through a different weakness: its current adoption remains broad while its trend declines.
BeaconDesk
70.7
Inspect
Top-user share, missing roles, backup champions
CedarOps
71.0
Inspect
Which workflow declined, which users stopped, seasonality
Same total, opposite problems: the score decides who gets reviewed, the components decide what gets asked.
| Account | What to inspect | Possible action |
|---|---|---|
| ArborGrid | Task success, important roles, and any hidden friction | Maintain the workflow and watch for material change. |
| BeaconDesk | Top-user share, permissions, missing roles, and backup champions | Broaden role-appropriate ownership where useful. |
| CedarOps | Which workflows and users drove the decline and whether it is seasonal | Investigate the changed workflow before outreach. |
| DeltaPilot | Setup milestones, time to first value, and onboarding peers | Use an onboarding score profile. |
How should thresholds and baselines work?
There is no universal “good” score. Thresholds depend on the formula, lifecycle, plan, use case, account size, expected cadence, and data coverage.
- Compare the account with its own equivalent prior periods.
- Compare it with accounts in the same lifecycle and use case.
- Add plan, size, or cadence when those factors change expected behavior.
- Use industry only when it produces a defensible difference and the cohort is large enough.
A global average can punish a specialist use case or make a high-volume segment look normal. Start with the account’s own history, then add the smallest peer definition that materially improves interpretation.
| Condition | Treatment |
|---|---|
| Account still onboarding | Use setup, activation, role participation, and time-to-value milestones. |
| Workflow is monthly or quarterly | Evaluate complete opportunity periods, not a universal recency threshold. |
| Peer group is small | Show the limitation and rely more on the account’s own history. |
| Required identity or instrumentation is missing | Show insufficient coverage rather than a low score. |
| One user dominates a collaborative workflow | Create a visible concentration review even when the composite is high. |
Thresholds should support a decision. “Needs review” is often more honest than a red label when the evidence is incomplete. Store the formula version and effective date so a configuration change does not look like customer movement.
Keep status labels stable
Labels that switch after every small daily movement create noise. Use a suitable observation window, minimum data requirements, and hysteresis or persistence rules where justified.
For example, an account may enter “needs review” only after two complete expected intervals below the threshold, while a confirmed severe failure creates an immediate separate alert.
Monitor the score as a product
- Track how many accounts lack sufficient data.
- Review the largest score movements for instrumentation or cohort changes.
- Record which components generate useful investigations.
- Retire signals that add noise without improving decisions.
- Revalidate after major product, packaging, or lifecycle changes.
A score that produces a number for every account can still be poor. Coverage, interpretability, and review yield are part of its quality.
Keep the old component values available when a version changes. Otherwise reviewers cannot distinguish customer movement from a revised formula.
How do you validate the score and act on it?
| Test | Practical check |
|---|---|
| Stability | Recalculate across equivalent windows and inspect unexplained movement. |
| Sensitivity | Confirm that known workflow, user, or cadence changes move the relevant component. |
| Noise resistance | Remove imports, retries, service accounts, or event spikes and compare the result. |
| Interpretability | Ask reviewers to name the main contributors and next investigation. |
| Review yield | Sample flagged accounts and record whether the signal produced a useful question. |
| Actionability | Ensure every material component links to evidence and an accountable owner. |
Route the investigation from the component: lost breadth to missing workflows, rising concentration to role coverage, declining consistency to cadence and recent visits, and high activity with friction to completion and errors.
A manually weighted score is not automatically predictive. A churn model needs a defined outcome, horizon, population, observation period, and validation on unseen time periods. Compare it with simple baselines and report false positives and false negatives.
When can a score be called predictive?
Define the outcome, prediction horizon, population, observation period, features available at prediction time, validation period, decision threshold, and costs of mistakes. Time-ordered validation avoids training on future periods while evaluating past ones.
For a review queue, track precision and review yield: how many flagged accounts match the declared outcome, and how often the signal produces a useful investigation. A complex model should outperform simple recency or activity-change rules before its opacity is justified.
| Visible signal | Inspect next | Possible response |
|---|---|---|
| Lost adoption breadth | Missing workflows, roles, access, and use-case change | Address discovery, fit, access, or product problems. |
| Rising concentration | Top-user share and backup coverage | Develop additional role-appropriate ownership. |
| Declining consistency | Expected cadence, seasonality, and recent Visits | Confirm whether the gap is abnormal. |
| High activity with friction | Completion, errors, retries, and support evidence | Investigate product or configuration problems. |
| Missing data | Identity, instrumentation, and service-account filters | Repair data before judging the customer. |
When a score is not predictive, validate it against its real purpose. Reviewers should be able to explain why an account was surfaced, locate the source evidence, and choose a relevant next step.
Which customer health score mistakes should you avoid?
- Using logins or page views as the dominant signal instead of meaningful workflows.
- Combining unrelated evidence into an opaque total without visible sub-scores.
- Treating missing identity or instrumentation as poor account health.
- Comparing onboarding accounts with mature customers.
- Letting one power user hide fragile role coverage.
- Changing definitions without versioning the formula, weights, bounds, and effective date.
- Presenting a descriptive or prioritization score as guaranteed churn prediction.
Weights should represent the customer workflow, not merely what is easy to capture. A reliable login event can still be a weak signal, while a harder-to-instrument successful output may be much closer to value.
Correlation also does not establish causation. Usage can be a leading signal, a symptom, a consequence, or a shared effect of another change. The score alone cannot decide which explanation is correct.
- Use product evidence to locate the changed workflow.
- Use account and user context to identify who is affected.
- Use selected Visits or support evidence to inspect the mechanism.
- Use customer conversations for needs, satisfaction, and intent.
Hymetry’s Companies, Users, and Visits keep an account signal connected to product areas, contributing users, and selected session evidence. The system does not claim to observe every cause of renewal risk.
Frequently asked questions
How do you calculate a customer health score?
Define the purpose, cohort, lifecycle, cadence, and source metrics. Normalize documented components, apply visible weights, and preserve each component and its movement.
Which product-usage metrics should it include?
Consider adoption, breadth, depth, consistency, distribution, trend, and reliably observed friction. Include only metrics that represent the product’s expected value and can be reproduced.
Is a health score the same as churn prediction?
No. A predictive model has a defined outcome and horizon and is evaluated on unseen periods. A descriptive composite or prioritization rule should be named accordingly.
How often should the score update?
Update often enough to detect relevant changes without moving faster than the workflow’s cadence. Calculation frequency and the interpretation window can differ.
Can product usage reveal customer intent?
No. Events show observed behavior, not budget decisions, leadership priorities, satisfaction, or renewal intent. Use product usage as one inspectable evidence layer.
Sources
Methodology and limitations
Official methodological and product documentation was prioritized. Vendor educational sources describe common practices but are not treated as independent proof that a particular score predicts churn. The formula and account data are illustrative.
Source directory
- Hymetry demo Companies view
- Gainsight: Customer health scores
- OECD and European Commission: Handbook on Constructing Composite Indicators
- Google Research: HEART user-centered metrics framework
- Pendo: Improve customer health and retention
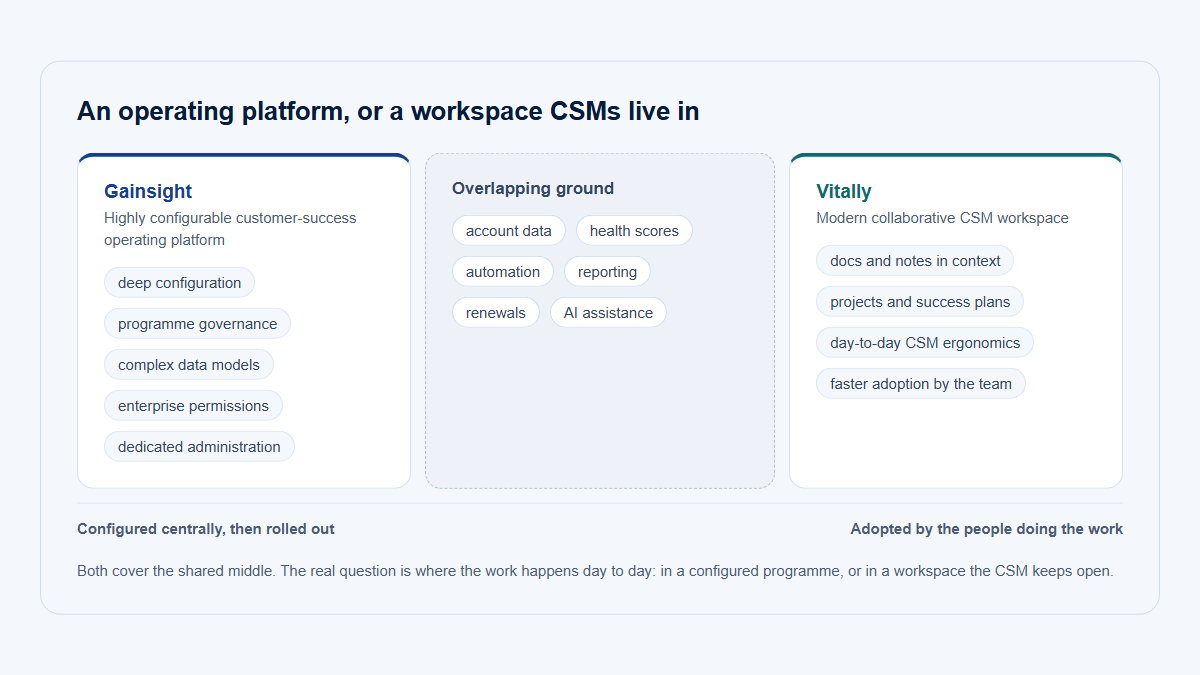
- Vitally: Health scores by lifecycle stage
- scikit-learn: TimeSeriesSplit
- scikit-learn: Precision score
- Hymetry Companies
- Hymetry Users
- Hymetry Visits
- Hymetry for customer success