Define the adoption metric first
| Field | Question | Example |
|---|---|---|
| Entity | Account, user, workspace, or another unit? | Eligible active customer accounts |
| Eligibility | Who had access, permission, prerequisites, need, and opportunity? | Established paid accounts with Reporting enabled and data connected |
| Behavior | What exact success threshold counts? | A permitted user completes and exports or schedules a report |
| Period | Which calendar, cohort, or opportunity window? | Deadline-aligned 45 days |
| Repetition | Is first use enough? | Completion in two reporting cycles |
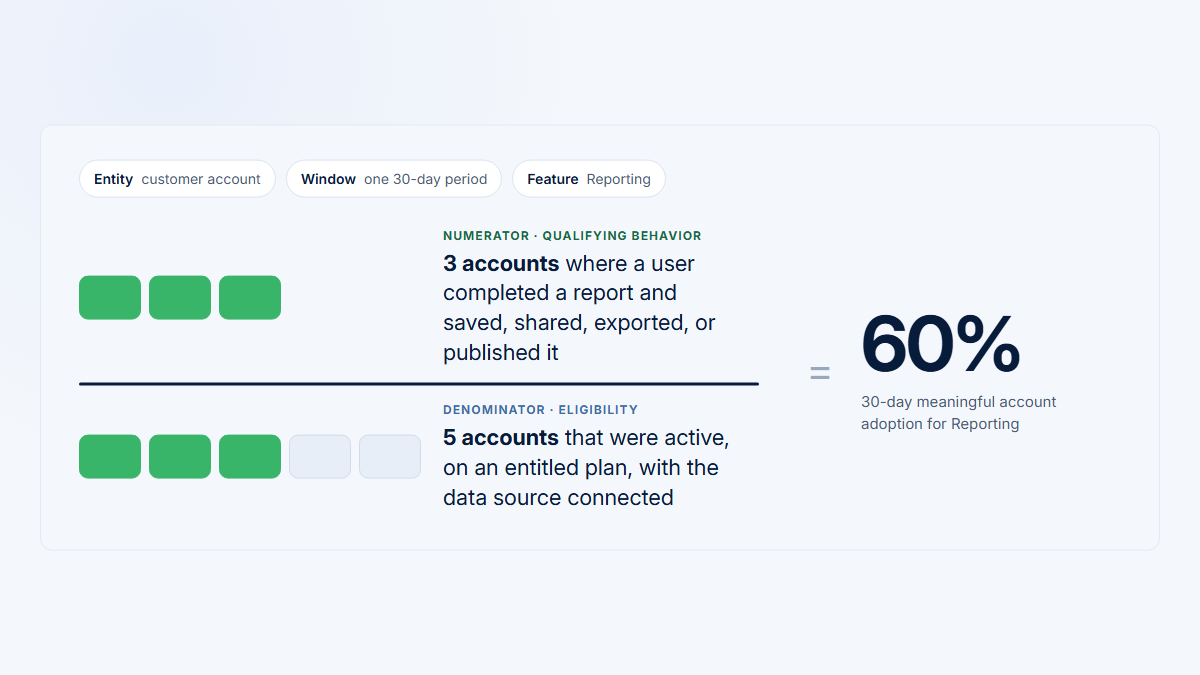
Account adoption rate
eligible active accounts meeting the threshold ÷ eligible active accounts × 100
User adoption rate
eligible active users meeting the threshold ÷ eligible active users × 100
User penetration inside adopting accounts
eligible users meeting the threshold inside adopting accounts ÷ eligible active users inside those accounts × 100
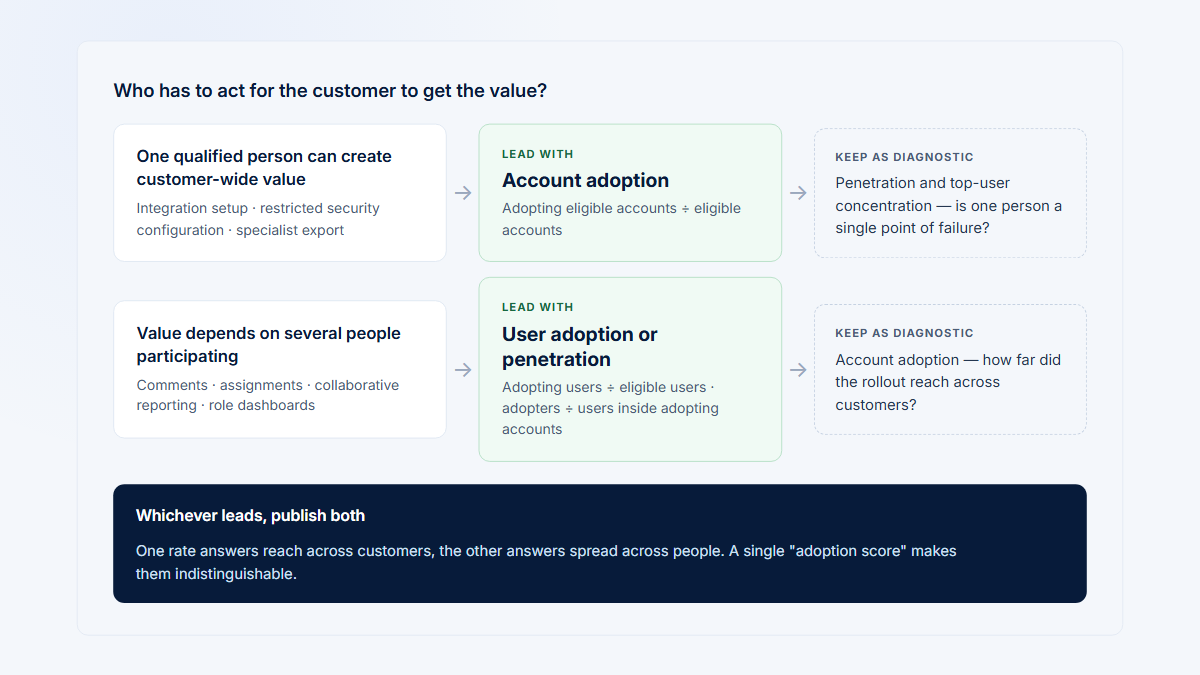
Account adoption shows customer reach; user adoption shows individual reach; penetration shows breadth after an account adopts. A setup owned by one administrator can have strong account adoption and correctly low interface penetration. A collaborative feature may require broad penetration. Keep page discovery, first use, recurring use, breadth, and depth separate when they answer different questions. See the feature adoption formula guide and account vs user adoption.
Feature context changes what “good” means
| Feature type | Primary expectation | Useful guardrail | Why a lower rate may be healthy |
|---|---|---|---|
| Core workflow | Broad eligible-account and user adoption | Completion and recurrence | Usually less defensible unless role-limited |
| Optional adjacent workflow | Growth in the relevant segment | Repeated success among adopters | Many eligible accounts may lack the use case |
| Administrator setup | Opportunity-adjusted completion | First successful downstream result | Only a few users should interact |
| Collaborative feature | Account reach plus participation breadth | User penetration and concentration | One champion is not full rollout |
| One-time configuration | Valid state among accounts reaching setup | Reliability after configuration | Repeat UI use can be a failure signal |
| Low-frequency workflow | Completion in realistic opportunity windows | Return across eligible cycles | A short calendar window omits opportunity |
| New release | Time-since-exposure cohort progression | Discovery-to-completion funnel | Many entities have not matured |
| Automated capability | Configuration plus successful system outcomes | Reliability and human review | Interface visits are not the value mechanism |
Feature adoption in context
The same 30% can mean four different things
Read the percentage through the measured entity, the feature’s job, its maturity, and the observation window.
30%Identical rate in every card. Only the context changes.
01 · Core workflow
Core collaborative workflow
30%
- Entity
- eligible active users
- Context
- mature and broadly relevant
InterpretationPotentially below expectation
02 · Optional
Optional integration
30%
- Entity
- eligible accounts
- Context
- newly released and use-case-specific
InterpretationPotentially encouraging
03 · Admin-owned
Administrator setup
30%
- Entity
- eligible administrators
- Context
- mature and mandatory
InterpretationConcerning after fair opportunity
04 · Low frequency
Quarterly workflow
30%
- Entity
- eligible accounts
- Context
- measured over only 30 days
InterpretationWindow too short to conclude
Reading rule. 30% is a signal to interpret, not a universal score. Entity, eligibility, maturity, and window decide what it means.
Use a hierarchy of comparisons
- The feature’s own history. Keep entity, eligibility, threshold, window, exclusions, and identity logic stable; show numerator and denominator.
- Exposure or release cohorts. Compare entities at equivalent days since eligibility, especially during staged rollout.
- Relevant internal peers. Use plan, lifecycle, size, role mix, implementation state, use case, and cadence only where they plausibly shape the metric.
- Intended product outcome. Check whether qualifying behavior corresponds with a completed workflow, shared artifact, configured state, or other observable result without claiming causation.
- External benchmarks. Use last and only after the population, entity, threshold, eligibility, window, and maturity match.
Comparison hierarchy
Start with the context closest to the feature
Move outward only after the more product-specific comparison is understood.
Strength of comparison falls at every step outward.
-
Step 1Start here
Own historical baseline
Preserve
Same definition
Closest context
-
Step 2Align exposure
Equivalent exposure cohort
Match
Same time since exposure
Close context
-
Step 3Match peers
Relevant internal peers
Match
Similar plan, lifecycle, size, role, setup, and use case
Relevant context
-
Step 4Check outcome
Intended outcome evidence
Connect
Behavior connected to intended result
Supporting context
-
Step 5Check fit
External benchmark
Verify
Methodology must match
Weak context · not a target
External benchmarks can still inform. Use them as a directional reference when the methodology matches — not as a universal product target. Check entity, eligibility, qualifying behavior, window, and aggregation before comparing.
A published benchmark can suggest terminology or dimensions, but it becomes a target only when its methodology is comparable. A precise number is still irrelevant if it counts a different entity or defines “use” as a page view while your metric requires completion.
Inspect the distribution and set a target range
A project-wide average can hide deep adoption in a few accounts, non-adoption in many others, one enterprise customer dominating user totals, or one champion dominating each account. Show account adoption, user adoption or penetration, median and relevant percentiles, segment breakdowns, change over time, and concentration together.
Top-user concentration
qualifying actions performed by the top N eligible users ÷ all qualifying actions × 100
Median is less distorted by extreme tails than mean, but neither is enough without the distribution. High concentration can be correct for specialist work and concerning for collaboration. A high percentile can also be unhealthy if it reflects retries or mandatory busywork.
Set the target before interpreting the next result:
- State the product decision and measured entity.
- Define eligibility, meaningful use, cadence, and opportunity window.
- Establish a comparable historical baseline and release cohorts.
- Separate only the customer segments that materially affect opportunity.
- Inspect account and user distributions.
- Choose an expected range, minimum floor, review threshold, time horizon, and maturity point.
- Add guardrails such as completion, recurrence, penetration, concentration, errors, time to first use, successful automation, or qualitative evidence.
- Version the metric when the feature, access, workflow, or instrumentation changes.
Reusable target statement
For [segment], among [eligible entity], [qualifying behavior] within [window] should fall within [range] by [maturity point], while [guardrails] remain within [declared limits].
What to include in an adoption review
Show the current and previous numerator, denominator, rate, and population composition. Add exposure age or opportunity count so recent accounts are not compared with mature accounts. For account metrics, show the distribution of user penetration and qualifying actions inside accounts; for user metrics, show how many accounts those users represent.
Break the result down only by dimensions with a plausible relationship to access or expected use: plan, lifecycle, size, implementation status, role mix, use case, and cadence. For each segment, display sample size and missing-data share. Check whether a customer, user, automation, or internal actor dominates the result. Link representative successful, stalled, and non-adopting Visits, but do not infer prevalence from a replay sample.
End with an explicit interpretation and next test: keep the target, investigate discovery, inspect completion failures, correct eligibility, support a rollout segment, or revise the definition. Record what evidence would cause the team to change that decision in the next review.
Worked example: five features, five expectations
| Feature | Context | Account result | User result | Penetration | Concentration/cadence | Interpretation |
|---|---|---|---|---|---|---|
| Daily Operations Dashboard | Mature core, daily | 146/200 = 73.0%; prior 69.5% | 840/1,500 = 56.0% | 840/1,110 = 75.7% | Top 10 accounts: 18% | Strong against its declared 70–80% range and broadly distributed |
| Monthly Reporting | Mature monthly workflow | 30 days: 40.0%; aligned 45 days: 67.8% | 130/360 = 36.1% | 130/220 = 59.1% | Deadline-aligned opportunity | Short window misleads; aligned result fits the 65–75% range |
| Enterprise SSO | Admin-owned setup | Broad: 45.0%; reached setup: 81.8% | 46/120 admins = 38.3% | 88.5% of eligible admins in adopting accounts | One-time then automated | Completion is strong among opportunities; setup-stage reach is only 55% |
| Collaborative Comments | Team workflow | 75.3% | 22.0% | 24.9% | One user creates >50% in 61% of adopters | Account reach hides weak rollout and champion dependence |
| Optional API Export | New specialist capability | 25.0%; prior 14.3% | 15.7% | 25.0% | 19/20 adopters repeat | Promising in its narrow segment despite the low headline rate |
Daily Operations Dashboard
The account rate rose 3.5 percentage points from 69.5% to 73.0%, inside the fictional 70–80% target. Penetration is 75.7%, and no small set of accounts dominates the total. That combination supports “strong relative to this product’s plan and history.” It does not turn 73% into a universal benchmark. The team should still segment the 54 non-adopting accounts by lifecycle, role availability, and implementation state.
Monthly Reporting
An arbitrary 30-day window reports 40.0%, apparently far below target. The same accounts measured across a complete deadline-aligned 45-day opportunity report 67.8%, up from 62.9% and inside the declared range. Both calculations are arithmetically valid; only the latter answers whether accounts completed the monthly job around a realistic deadline. This is why cadence belongs in the metric contract.
Enterprise SSO
Using all 100 contracted accounts produces 45.0%, which exposes that many accounts have not reached implementation. Among the 55 accounts that did reach the setup opportunity, 45 completed it, producing 81.8%. Report both: completion is strong after opportunity, while setup-stage reach is only 55.0%. Low broad user penetration is expected because one or two qualified administrators configure SSO for everyone else.
Collaborative Comments
The 75.3% account rate meets the fictional account target, but only 24.9% of eligible users inside adopting accounts qualify, and one user creates more than half the comments in 61% of those accounts. Because collaboration requires distributed participation, the guardrails contradict the headline. Investigate first contribution, replies, role coverage, and Visits where users reach the surface but do not participate.
Optional API Export
A 25.0% account rate looks low beside a core feature, but this capability is new, optional, and relevant only to a narrow technical segment. It grew from 14.3%, and 19 of 20 adopting accounts repeated successful exports. Volume is concentrated in five accounts, which deserves monitoring but may reflect legitimate integration-heavy use. The right question is whether the intended segment succeeds, not whether all customers use an API.
Fictional B2B feature portfolio
The rate is only one part of the interpretation
Each feature carries its own eligible denominator and intended workflow. The order follows the worked example, not best to worst.
Illustrative data — not a benchmark.
-
01
Daily Operations Dashboard
Core workflow
Account adoption
73.0%
146 / 200 eligible accounts
User penetration
75.7%
840 / 1,110 eligible active users in adopting accounts
- Dailyqualifying use on 5 of 30 days
- Mature18 months since release
- Broadly distributedtop 10 accounts: 18% of user-days
Matches internal target. Broad use supports the result; inspect the remaining gaps.
-
02
Monthly Reporting
Periodic workflow
Account adoption
40.0%
72 / 180 · arbitrary 30-day slice
67.8%
122 / 180 · deadline-aligned window
User penetration
59.1%
130 / 220 eligible permitted users in adopters
- Monthlydeadline-aligned 45-day window
- Mature12 months since release
- Broadly distributedtop 10 accounts: 15% of completions
Align the opportunity. A 30-day calendar slice understates this workflow by 27.8 points.
-
03
Enterprise SSO Setup
Admin-owned setup
Account adoption
45.0%
45 / 100 · all contracted accounts
81.8%
45 / 55 · accounts that reached the opportunity
User penetration
88.5%
46 / 52 eligible admins · 5.1% of all 900 users
- One-time setupthen automated use
- Mature24 months since release
- Role-concentratedadmin-owned by design; value automated
Separate two questions. Contract reach differs from completion after opportunity.
-
04
Collaborative Comments
Collaborative workflow
Account adoption
75.3%
143 / 190 eligible accounts
User penetration
24.9%
286 / 1,150 eligible active users in adopting accounts
- Weeklyqualifying use on 2 of 30 days
- Mature10 months since release
- Concentratedin 61% of adopters one user creates over half
Reach masks rollout. Low penetration conflicts with collaborative intent.
-
05
Optional API Export
Optional specialist workflow
Account adoption
25.0%
20 / 80 eligible accounts
User penetration
25.0%
22 / 88 eligible active users in adopting accounts
- Weekly / automatedrepeat across 4 weeks
- New release3 months since release
- Narrow and repeated5 accounts: 68% of volume; 19 / 20 repeat
Promising in context. Inside the early target; the narrow value is repeated.
Read across a row, never down a column. The lowest headline rate here is the healthiest result and the highest hides a rollout problem.
The Dashboard’s 73% is strong because it matches history, target, penetration, and distribution. Reporting’s 40% is an artifact of a short calendar window. SSO’s broad 45% exposes an implementation-stage problem while 81.8% shows strong completion after opportunity. Comments has high account reach but low participation. API Export’s 25% is encouraging because it is new, optional, growing, and repeats in 95% of adopters.
Selected calculations
Dashboard percentage-point change: 73.0% − 69.5% = +3.5 percentage points.
Opportunity-adjusted SSO completion: 45 configured ÷ 55 reaching implementation × 100 = 81.8%.
SSO setup-stage reach: 55 reaching implementation ÷ 100 contracted × 100 = 55.0%.
Repeated API use: 19 repeating accounts ÷ 20 adopting accounts × 100 = 95.0%.
Know when low or high adoption needs investigation
| Pattern | More concerning when | Potentially acceptable when |
|---|---|---|
| Low account adoption | Core feature, mature, broadly eligible, repeated opportunities, flat completion | New, optional, specialist, staged, or prerequisite-limited |
| Low user penetration | Value requires collaboration or broad role participation | Administrator or specialist ownership is intended |
| High adoption | Driven by mandatory clicks, retries, shallow views, or a few accounts | Qualifying behavior is durable and guardrails remain healthy |
| High concentration | Collaboration should spread and champions are fragile | A specialist legitimately owns the job |
Low adoption is a prompt to inspect eligibility, discovery, completion, cadence, segmentation, and Visits—not proof that a feature should be removed. High adoption is not automatically healthy if the behavior is superficial, required, error-driven, or disconnected from the intended outcome.
Read the denominator and uncertainty
Always show the numerator and denominator beside the percentage. A move from 20 of 40 eligible accounts to 30 of 100 is a decline from 50% to 30% even though ten more accounts adopted. Conversely, a stable rate can hide rapid growth if the eligible population expanded. Review population composition, missing eligibility data, exposure age, and confidence or uncertainty appropriate to the sample before attributing a change to product work.
For small segments, prefer counts and wide uncertainty over a dramatic percentage. A one-account change may look large but still be operationally ambiguous.
External benchmark checklist
- Same entity and denominator?
- Same eligibility, role, and prerequisite rules?
- Same qualifying behavior and deduplication?
- Same period, cadence, and time since exposure?
- Comparable feature type, maturity, customer mix, and plan?
- Distribution and sample size disclosed?
- Mean, median, and percentile labels clear?
- Vendor methodology current and reproducible?
If any answer is unknown, use the benchmark as context for a question, not a target.
Distinguish a benchmark selected in advance from an explanation chosen afterward. Searching for a favorable external number after observing 30% does not validate the feature. Record the target range, guardrails, and review threshold before the next period. If a product or customer-context change makes that target obsolete, document why, publish the effective date, and avoid splicing incompatible definitions into one trend.
External sources often aggregate many features into one distribution. A feature portfolio can contain core navigation, optional integrations, administrator setup, collaboration, automation, and seasonal work. Even a methodologically sound portfolio average may be useless for any one feature. Prefer a comparable feature type and report uncertainty; do not turn a vendor percentile into a contractual product goal.
Connect adoption to account context
Hymetry connects grouped Pages and product areas to Companies, Users, and Visits. A team can inspect account adoption, user penetration, concentration, historical change, and the sessions behind a surprising result without treating one percentage as the conclusion.
Hymetry does not supply a universal benchmark. The team remains responsible for meaningful use, eligibility, cadence, target ranges, and causal limits.
Frequently asked questions
What is a good feature adoption rate?
One that meets a predeclared expectation for the feature’s entity, eligibility, meaningful behavior, cadence, maturity, segment, history, and guardrails. No universal percentage applies.
Is 30% feature adoption good?
It can be strong for a new optional integration and weak for a mature core workflow. The number is uninterpretable without the denominator, behavior, period, and product context.
What is the average SaaS feature adoption rate?
Published averages use different entities, feature sets, usage thresholds, populations, and windows. Do not treat one as a target unless the full methodology matches.
Should B2B SaaS measure adoption by account or user?
Usually both. Account adoption measures customer reach; user adoption and penetration reveal breadth and champion dependence.
How long should adoption be measured?
Long enough to include realistic opportunities. Use time since exposure for releases and cadence-aligned windows for scheduled or recurring work.
Can low feature adoption be healthy?
Yes for optional, specialist, one-time, low-frequency, new, staged, or automated features when the eligible segment and outcomes are healthy.
Can high feature adoption be unhealthy?
Yes when it reflects mandatory navigation, retries, shallow views, automation counted as people, or concentration that contradicts the value model.
Should a target be one number or a range?
A range plus a floor and review threshold is usually more defensible. Use precision only when sample size and operating process justify it.
Sources
Method note: Sources were reviewed August 4, 2026. Vendor benchmarks illustrate disclosed methodologies; they are not treated as universal standards.
Methodology and evidence limits
The framework prioritizes a reproducible internal definition, comparable historical and exposure cohorts, distributions, and declared targets. External benchmark numbers were not imported into the recommendation. Correlation between adoption and an outcome does not establish causation.
Full source directory
Additional preserved references
These references supported the original detailed guide and remain available for claim verification and further reading.