When is low usage genuine underuse?
A feature is underused when eligible entities use it less often, less broadly, or less meaningfully than expected despite realistic opportunities. Low volume alone is insufficient.
| Question | Healthy low-frequency use | Possible underuse |
|---|---|---|
| Opportunity | Few relevant cycles or trigger events occurred. | Opportunities remained stable or increased. |
| Discovery | Users enter only when the job is due. | Eligible users repeatedly miss the entry point. |
| Completion | Most opportunities reach the intended outcome. | Users start but abandon or fail. |
| Recurrence | Use returns at the monthly, quarterly, annual, or event-driven cadence. | Expected cycles pass without completion. |
| After setup | Configuration stays quiet while automated output remains healthy. | Setup repeats, fails, or produces no downstream output. |
| Alternative path | The job is intentionally completed elsewhere. | Users rely on manual workarounds because the feature fails their need. |
Examples of naturally infrequent workflows include monthly reporting, quarterly planning, annual compliance, one-time integrations, offboarding, incident exports, and renewal administration.
“Low-frequency” is not an excuse for repeated abandonment. Cadence explains how often the job should occur, not why users fail when they try.
Define expected use before interpreting volume
- The account or user for whom the feature is relevant
- The plan, role, permission, setup, and lifecycle requirements
- The calendar cycle, event, or task that creates an opportunity
- The successful output or state that represents meaningful completion
- The cadence at which another opportunity should occur
A feature cannot be called underused because another feature generates more events. A daily dashboard and annual compliance workflow perform different jobs and require different expectations.
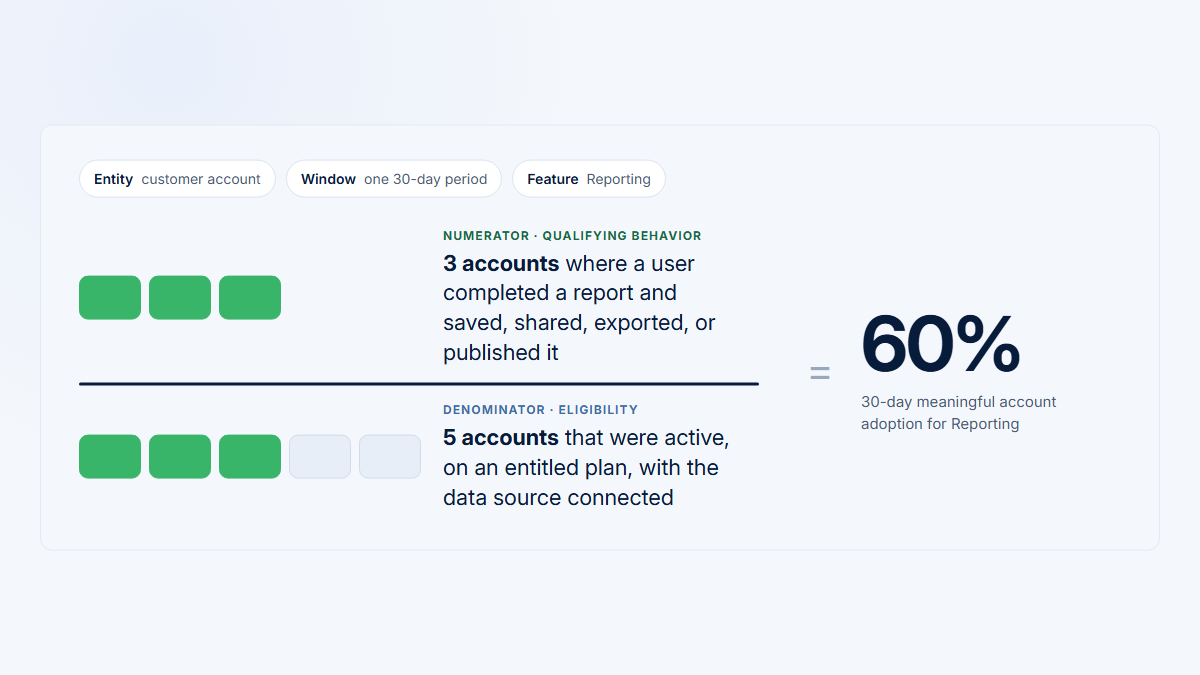
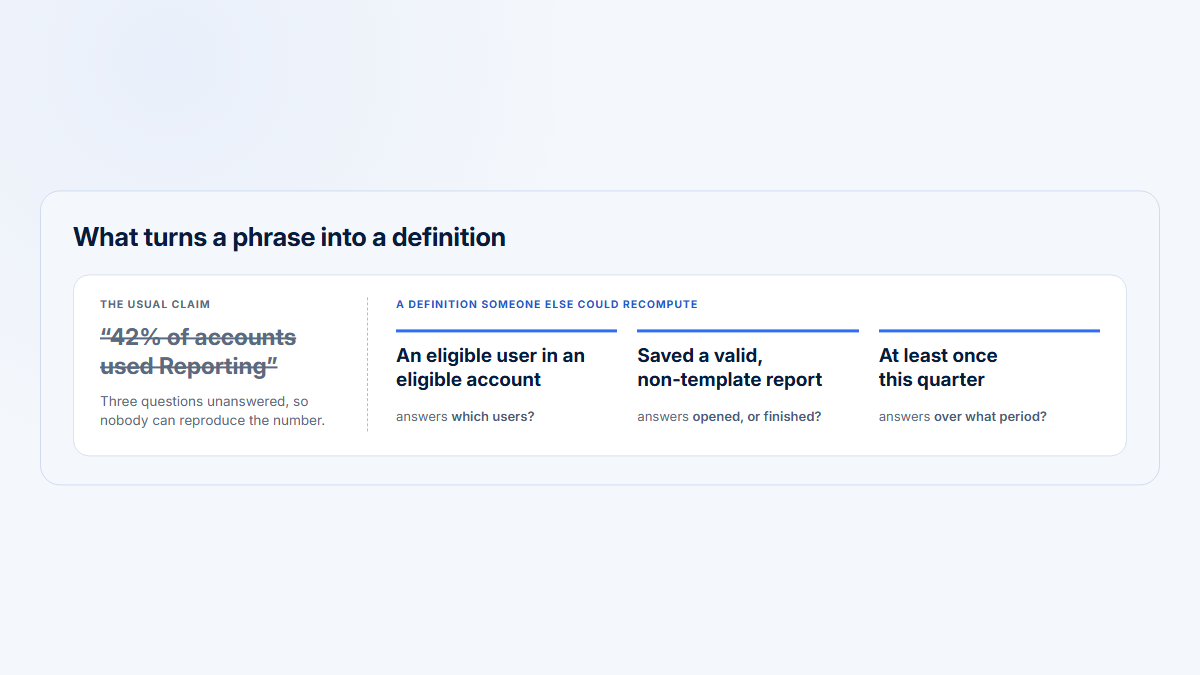
For the general account-or-user formula, see feature adoption rate. For selecting a value-bearing action, see meaningful feature use.
How do you measure opportunity and cadence?
Eligibility asks who can and should use the feature. Opportunity asks whether an eligible entity encountered a realistic reason to use it during the period.
Opportunity-normalized completion
Eligible opportunities with meaningful completion ÷ total eligible opportunities × 100
The denominator may be an account-month, account-quarter, account-event, or user-event. Count one meaningful completion against the opportunity it serves; retries and repeated page loads should not inflate the numerator.
| Cadence | Example | Useful unit | Interpretation risk |
|---|---|---|---|
| Continuous | Integration sync | Configuration plus output health | Calling low UI activity low value |
| Daily | Operations review | Eligible account-days | Counting entry instead of completion |
| Weekly | Team review | Eligible account-weeks | Applying a daily threshold |
| Monthly | Invoice reconciliation | Eligible account-months | Using a partial month |
| Quarterly or annual | Planning or compliance | Complete due-date cycles | Observing before the due period |
| One-time | Initial integration | Eligibility cohort and time to completion | Expecting recurring setup visits |
| Event-driven | Offboarding or incident export | Eligible trigger events | Using all active accounts as the denominator |
One threshold cannot fit every cadence
Daily operations
Eligible account-days — about 180
Weekly review
Eligible account-weeks — 26
Monthly reconciliation
Eligible account-months — 6
Quarterly planning
Complete due-date cycles — 2
One-time integration
Eligibility cohort — 1
Incident export
Qualifying trigger events — 3
One six-month period, same width for every row
Opportunity-normalized completion divides meaningful completions by the eligible opportunities that actually occurred — not by all active accounts.
If a clean opportunity event does not exist, use a labeled proxy such as month-end active accounts, renewal-stage accounts, prerequisite completion, an assigned task, or a qualifying incident record.
A permissioned user is only a proxy for opportunity because permission does not prove need. A page visit is only a discovery proxy because it does not prove the user recognized the feature or intended to complete the job.
Choose a window that includes enough complete opportunities without combining incompatible product versions, lifecycle stages, plan changes, or seasonal cycles. Longer is not automatically better.
- Compare month-end with month-end rather than a partial calendar month.
- Compare quarter-end planning with a prior complete planning cycle.
- Start one-time setup cohorts when each account first becomes eligible.
- Align event-driven workflows to the trigger rather than a generic active-account period.
| Workflow | Opportunity unit | Meaningful completion |
|---|---|---|
| Monthly reporting | Eligible account-month due | Report successfully generated and shared |
| Renewal administration | Account entering the renewal window | Required configuration completed |
| User offboarding | Assigned departure event | User access removed and workflow confirmed |
| Incident export | Qualifying incident | Required export generated successfully |
| Initial integration | Newly eligible account | Connection established and first sync confirmed |
Account adoption and opportunity completion answer different questions. A feature can reach many relevant accounts yet fail across repeated cycles, or reach a smaller specialist cohort and complete nearly every real opportunity.
Lifecycle changes the opportunity model
New accounts may still be completing prerequisites, while mature accounts should already know the workflow. Reactivated, expanding, and renewal-stage accounts can also have different reasons and time to act.
- Onboarding: measure prerequisite and first-value milestones.
- Mature: compare complete recurring opportunity periods.
- Reactivated: separate renewed opportunity from historical inactivity.
- Renewal-stage: align analysis with the actual renewal workflow.
Segment before interpreting the rate. A recently eligible account should not be compared with one that had six months to complete one-time configuration.
Event-driven work needs the same discipline. If nine incidents occurred, nine incidents—not all active accounts—form the immediate production opportunity denominator.
How do you diagnose low feature usage?
- Eligibility: Which accounts and roles have access, prerequisites, responsibility, and a relevant use case?
- Opportunity: Did the calendar cycle, business event, assigned task, or prerequisite create a reason to act?
- Discovery: Did the relevant users reach or notice the entry point?
- Progress: Did they begin the substantive workflow rather than merely open the page?
- Completion: Did a trustworthy event or state confirm the intended output?
- Recurrence: When the job repeats, did completion return in later opportunity periods?
Answer these in order, or you will misdiagnose
1
Eligibility
Who has access, prerequisites and responsibility?
2
Opportunity
Did a cycle, event or task create a reason to act?
3
Discovery
Did those users reach the entry point?
4
Progress
Did they begin the work, not just open the page?
5
Completion
Did a trustworthy event confirm the output?
6
Recurrence
Did completion return in later opportunity periods?
Check alongside, at every step
Recurrence cannot be diagnosed before an eligible opportunity is confirmed. Low volume at step 2 is not the same finding as low volume at step 5.
At every stage, also inspect distribution, substitution, automation, seasonality, lifecycle, and data quality. A page view proves reach; a button click may prove an attempt; a server-confirmed output is stronger completion evidence.
Compare successful and unsuccessful Visits selected from the same account segment, role, opportunity, and product version. Session evidence can support a hypothesis but cannot establish prevalence or intent by itself.
Interpret each stage narrowly
| Stage | Useful evidence | Do not assume |
|---|---|---|
| Eligibility | Plan, role, permission, prerequisite, use case, active status | Every account or user record belongs in the denominator. |
| Opportunity | Due period, trigger event, assigned task, or prerequisite state | Access means the job was needed. |
| Discovery | Entry-point exposure, grouped-page reach, or search | Page reach means adoption. |
| Progress | First intentional step and intermediate workflow states | Entry proves a serious attempt. |
| Completion | Confirmed output or successful state change | A click proves the business outcome. |
| Recurrence | Completion in later eligible periods | Every successful job should repeat weekly. |
Data quality can imitate underuse. Missing account identity, duplicate attempts, internal traffic, service accounts, failed client events, and changed feature grouping can alter both numerator and denominator.
When completion requires several steps, keep the intermediate states. Discovery-to-start and start-to-completion rates help separate placement problems from workflow friction.
Recurrence should begin only after a later opportunity occurs. An account cannot fail a monthly recurrence rule before the next month-end, and a one-time integration does not need another setup attempt after success.
Which pattern best explains the low volume?
| Observed pattern | Likely investigation |
|---|---|
| Low discovery despite known opportunity | Placement, onboarding, permissions, role ownership, or alternative routes |
| High discovery but low progress | Relevance, entry-state clarity, missing prerequisites, or weak intent |
| High starts but low completion | Errors, workflow complexity, confusing state, or unreliable instrumentation |
| Good completion but no expected recurrence | Cadence, changed need, substitution, ownership change, or retention |
| One specialist performs all work | Expected role specialization versus fragile champion concentration |
| Quiet interface after one-time setup | Configuration persistence and automated output health |
| Low feature usage but job still occurs | Another feature, integration, API, spreadsheet, support process, or external tool |
| Layer | Question | Example evidence |
|---|---|---|
| Configuration adoption | Did eligible accounts enable the capability correctly? | Successful setup, permission grant, first test |
| Automated output health | Does the system continue delivering the result? | Sync freshness, job success, failures, delivered outputs |
| Human interaction | When do people review, change, or resolve something? | Configuration changes, exception handling, selected Visits |
Low UI activity can coexist with substantial value, but quiet screens do not prove healthy automation. Combine interface behavior with trustworthy system or operational data.
Check who performs the workflow
Low user penetration may be correct for administrator-owned billing or integration setup. The same one-person concentration may be fragile in a collaborative workflow or when no backup owner exists.
Inspect adoption at the account level, then the roles and users behind it. Large accounts or specialists can dominate global totals and hide how many customers actually complete the job.
Look for substitution before declaring poor fit
Users may complete the job through another product area, API, integration, spreadsheet, support request, or external system. Substitution can mean healthy flexibility, missing functionality, or an avoidable workaround.
- Check whether the underlying business outcome still occurs.
- Compare the product path with alternative paths.
- Ask whether the alternative is intentional and supported.
- Use direct customer evidence when the reason is not observable.
Signals that genuine underuse is more plausible
- Stable or rising eligible opportunities with declining meaningful completion
- High discovery followed by repeated abandonment
- Comparable accounts with the same access, lifecycle, role coverage, and need performing differently
- Repeated setup Visits without a successful state
- Support evidence or manual workarounds aligned with the behavioral gap
- Previously adopted workflows disappearing while need and access remain
No single item proves the cause. Together they narrow the investigation toward discovery, friction, fit, ownership, or measurement.
Use relevant peers cautiously. Similar plan, size, lifecycle, role structure, prerequisites, and use case matter more than a global product average. Small peer groups should show counts and uncertainty.
What does raw volume get wrong?
This six-month example for a fictional 48-account product is illustrative, not Hymetry customer data or a benchmark.
| Workflow | Eligible opportunities | Raw Visits | Meaningful completions | Completion |
|---|---|---|---|---|
| Daily Operations Dashboard | 6,048 account-days | 14,200 | 1,840 reviews | 30.4% |
| Monthly Reporting | 270 account-months | 680 | 233 reports | 86.3% |
| Quarterly Planning | 72 account-quarters | 240 | 58 plans | 80.6% |
| One-time CRM Integration | 30 newly eligible accounts | 155 | 26 connections | 86.7% |
| Incident Export | 9 qualifying incidents | 27 | 8 exports | 88.9% |
- The dashboard has the most traffic but the weakest completion against expected opportunities.
- Monthly and quarterly workflows look quiet in daily data but complete most observed cycles.
- The CRM setup should become quiet after success; connection persistence matters next.
- Incident Export is rare because only nine incidents created a production opportunity.
Illustrative: raw volume ranks it first, completion ranks it last
Workflow
Raw Visits
Completion against opportunities
Daily Operations Dashboard
Monthly Reporting
Quarterly Planning
One-time CRM Integration
Incident Export
Always show the opportunity count beside the percentage. Incident Export is eight successes from nine events — one more failure moves that rate by eleven points.
The example does not prove that the dashboard design is poor or that the low-frequency workflows create customer value. It identifies which workflow-opportunity pairs deserve review and which raw-volume rankings are misleading.
Show opportunity counts beside percentages. Incident Export’s 88.9% is eight successes from nine events, so one additional failure would move the rate materially.
Inspect the accounts behind the rate
Monthly Reporting completed 233 of 270 account-month opportunities, but the remaining 37 should be reviewed by account, role, and month. A recurring gap in the same customers differs from isolated missed cycles.
The CRM Integration result also needs persistence evidence. Twenty-six first connections are useful only if the connection continues syncing data or produces the intended downstream output.
How should you evaluate and act on the result?
- Define the job, entity, and eligibility.
- Name the opportunity and meaningful completion.
- State the expected cadence and choose complete periods.
- Compare discovery, progress, completion, and recurrence.
- Segment by lifecycle, role, use case, and account.
- Inspect substitution, automation, and selected successful and failed Visits.
- Classify the strongest issue and remeasure with the same definition.
This conclusion identifies the population, opportunity, outcome, comparison, and stage without claiming a cause the evidence does not prove.
Common interpretation mistakes
- Using the same seven- or 30-day period for every feature
- Comparing daily and quarterly workflows by raw event volume
- Ignoring access, prerequisites, roles, and realistic opportunity
- Treating one-time setup as failed retention
- Assuming low interface activity means low automated value
- Using page views instead of meaningful completion
- Allowing “low-frequency” to excuse high abandonment
- Comparing onboarding accounts with mature customers
- Summing daily distinct users or companies
- Reporting percentage change without the underlying counts
Keep the definition stable when remeasuring. Changing the window or denominator until the result looks healthy makes the analysis non-reproducible.
| Strongest diagnosis | Possible next step |
|---|---|
| Discovery | Improve placement, permission clarity, onboarding, or role routing. |
| Progress | Clarify prerequisites and the first intentional step. |
| Completion friction | Investigate failures, state, copy, workflow complexity, and support evidence. |
| Cadence mismatch | Change the window and target to the real opportunity cycle. |
| Substitution | Decide whether the alternative path is supported, superior, or an avoidable workaround. |
| Healthy automation | Monitor configuration and output health rather than UI frequency. |
| Measurement problem | Repair identity, event semantics, deduplication, or opportunity data first. |
A responsible conclusion may be “insufficient opportunity data” or “healthy for the observed cadence.” The framework should not force every low-volume feature into an underuse label.
Keep a reproducible measurement record
- Product job and decision
- Account or user entity
- Eligibility and opportunity rules
- Discovery, progress, and completion events
- Cadence and observation window
- Lifecycle, role, and use-case segments
- Substitution and automated-output evidence
- Exclusions, data-quality checks, owner, and version
When comparing periods, show raw opportunities and completions beside percentage movement. A rise from one completion to two is 100%, but it is still one additional completion.
Hymetry connects Pages, Companies, Users, and Visits so product and customer-success teams can move from a workflow trend to the accounts, users, and selected session evidence behind it. Teams still define cadence, eligibility, opportunity, and business meaning.
Frequently asked questions
What feature-adoption window should I use?
Use a window containing enough complete opportunities for the workflow’s cadence. One-time and event-driven features often need eligibility cohorts or trigger-aligned windows.
Is low feature usage always a problem?
No. Monthly, quarterly, annual, one-time, specialist, event-driven, or automated workflows may be healthy with low raw activity.
What if I do not capture opportunity events?
Use a transparent proxy and state its limits. If no defensible proxy exists, report raw counts and say the opportunity denominator is unknown.
Should one-time setup have a retention metric?
Measure eligible completion, time to completion, failure rate, and persistence of the resulting configuration. Weekly returns to setup are usually the wrong outcome.
What if only one role uses the feature?
Use role-specific eligibility. Specialist ownership can be healthy, but one-person dependence may be risky when collaboration or backup coverage matters.
Sources
Methodology and limitations
Primary research and official analytics documentation were prioritized. The worked values are fictional and illustrate why raw volume and opportunity-normalized completion answer different questions.
Source directory
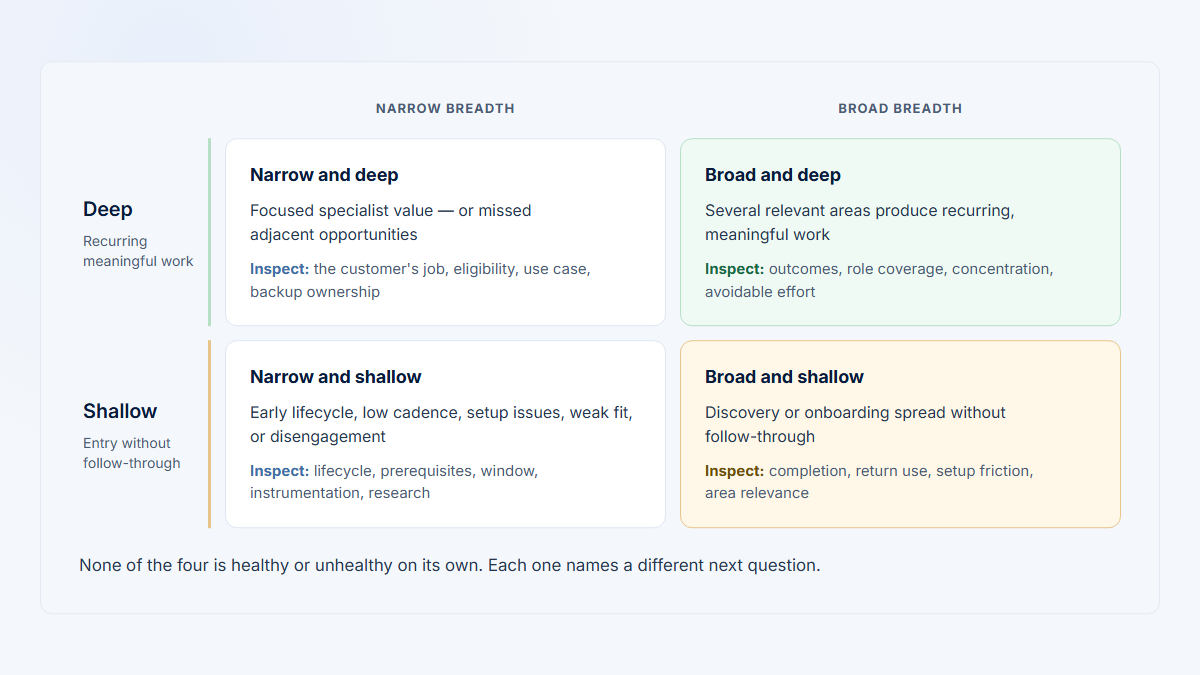
- Guide to adoption breadth versus depth
- Guide to page views, Visits, sessions, and engaged time
- Hymetry workflow for product teams
- Google Research: User-centered metrics for web applications
- Google Analytics: About events
- Google Analytics: Cohort exploration
- Mixpanel: Analyze user engagement
- Mixpanel: Retention report
- Mixpanel: Retain your users
- Mixpanel: Group Analytics
- US Census Bureau: Time series and seasonal adjustment
- Nielsen Norman Group: Designing for large user audiences
- Nielsen Norman Group: Frequency and recency
- Nielsen Norman Group: Diary studies