What is champion concentration risk?
Champion concentration risk is the possibility that healthy-looking account usage depends heavily on one person. The useful distinction is between observed behavior and organizational role.
| Term | Meaning | What product data cannot prove |
|---|---|---|
| Power user | A relatively frequent, broad, or advanced user. | Advocacy, authority, teaching, or internal trust. |
| Product champion | A person who promotes, owns, or helps others adopt an important workflow. | The organizational role from activity volume alone. |
| Backup champion | Another person capable of sustaining knowledge, permissions, workflow ownership, or advocacy. | Willingness, influence, or readiness to take over. |
| Usage concentration | The extent to which meaningful activity comes from a small number of users. | Whether that distribution is healthy without product and customer context. |
Measure concentration at the grain that matches the decision: whole product, product area, grouped page, or critical workflow. The distinction also matters in account versus user adoption: account totals show what happened, while user distribution shows who made it happen.
How can identical account totals hide different risk?
The example is fictional and uses the same 30-day window.
| Metric | Distributed account | Concentrated account |
|---|---|---|
| Meaningful actions | 100 | 100 |
| Engaged time | 300 minutes | 300 minutes |
| Visits | 20 | 20 |
| Product areas / active users | 4 / 5 | 4 / 5 |
| User action distribution | 20, 20, 20, 20, 20 | 85, 5, 4, 3, 3 |
| Top-user share | 20% | 85% |
| Users completing the core workflow | 5 | 1 |
Identical in both accounts · 30 days
100 meaningful actions
300 engaged minutes
20 Visits
4 product areas
5 active users
Distributed account
Top-user share 20%
Core workflow completers 5
Concentrated account
Top-user share 85%
Core workflow completers 1
Every account-level total matches. Only the distribution behind them differs — and only one of the two survives the champion changing jobs.
The concentrated account is not automatically unhealthy. A specialist may legitimately create outputs that many colleagues consume. The distribution instead prompts specific questions: can anyone else continue the workflow, are other users receiving role-appropriate value, are permissions and knowledge shared, and did concentration rise because participation fell?
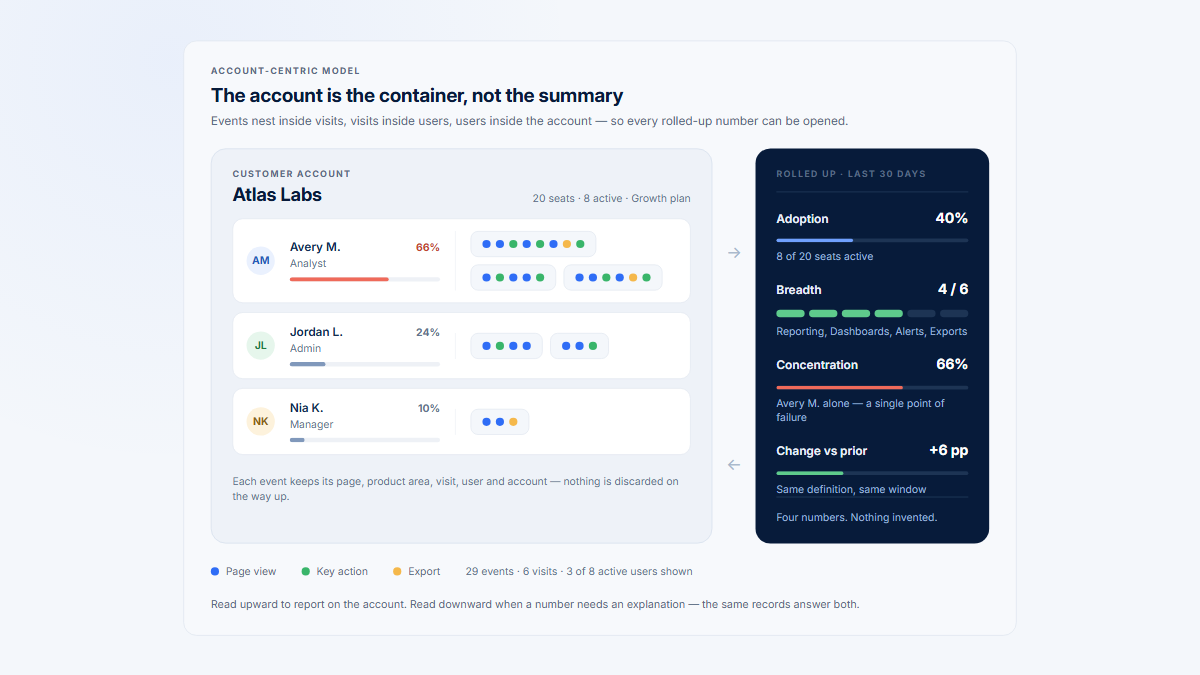
A useful B2B product analytics model therefore preserves the users behind every account total.
Which concentration metrics should you calculate?
Start with transparent shares tied to activity that represents product value.
Top-user concentration
C1 = a(1) / Σai x 100%
For 203 of 260 meaningful actions, 203 / 260 x 100 = 78.1%.
Top-two-user concentration
C2 = (a(1) + a(2)) / Σai x 100%
For 203 and 29 of 260 actions, (203 + 29) / 260 x 100 = 89.2%. The gap between top-one and top-two helps show whether a substantial second contributor exists; it does not prove backup capability.
| Companion measure | Calculation or definition | Question |
|---|---|---|
| Eligible users | People whose role, access, plan, and lifecycle make the workflow relevant | Who could reasonably participate? |
| Active-user coverage | active / eligible x 100 | Who used the product at all? |
| Meaningful-user coverage | meaningful users / eligible x 100 | Who did more than browse? |
| Core-area participation | users in the critical area / eligible x 100 | How broadly is value-bearing work shared? |
| Multi-period continuity | Users active in a documented number of recent periods | Is participation recurring? |
Optional whole-distribution index
An HHI-style index uses H = Σsi2, where user activity shares sum to one. Six equal contributors produce 6 x (1 / 6)2 = 0.167; one user at 80% plus five at 4% produces 0.802 + 5 x 0.042 = 0.648. This adapts the squared-share idea only. Do not import official antitrust thresholds into SaaS account health.
Choose completed workflows, meaningful actions, recurrence, active days, role-appropriate area use, or engaged time with outcome context. Raw page views, clicks, all events, and elapsed time can reward navigation, retries, automation, internal staff, or friction.
| Candidate activity | Use when | Guardrail |
|---|---|---|
| Completed core workflows | The product exposes a reliable success endpoint. | Keep different workflow types separate if effort or value differs. |
| Meaningful actions | A reviewed taxonomy maps events to progress. | Exclude retries, automated jobs, support work, and duplicated events. |
| Active days or periods | Continuity matters more than raw volume. | Match the denominator to daily, weekly, monthly, or quarterly cadence. |
| Engaged time | Long-form creation work lacks a clean completion event. | Pair time with outputs because longer can also mean friction. |
| Product-area breadth | Responsibility spans several relevant areas. | Count role-eligible areas, not every reachable URL. |
Calculate concentration separately for distinct critical workflows before using an account-wide rollup. An administrator may legitimately own nearly all integration maintenance while collaborative reporting should involve several people. Combining those activities can hide both healthy specialization and a reporting dependency.
When is high concentration healthy or fragile?
| Expected specialization | Potential fragility |
|---|---|
|
|
Combine concentration with breadth across relevant users, roles, and product areas. The matrix routes an investigation; it is not a health verdict.
Narrow product use
Broad product use
High concentration
One person produces most meaningful work
Narrow product use
Inspect
Lifecycle, specialist fit, permissions, and whether any backup ownership exists
Broad product use
Inspect
Whether all that breadth belongs to the same person
Low concentration
Meaningful work is shared across users
Narrow product use
Inspect
Whether a focused workflow matches the intended use case
Broad product use
Inspect
Recurrence and role coverage — confirm it holds across periods
Four quadrants, four investigations. None of them is a health verdict on its own.
- Low concentration, broad participation: confirm recurrence and role coverage.
- High concentration, broad product use: check whether breadth belongs almost entirely to one person.
- Low concentration, narrow use: test whether a focused workflow matches the intended use case.
- High concentration, narrow use: check lifecycle, specialist fit, permissions, and backup ownership.
Link the analysis to adoption breadth versus depth: concentration adds the question of who produces that breadth and depth.
What does a worked account example show?
All companies and numbers are fictional. “Meaningful actions” combine role-appropriate outcomes such as completing reports, sharing outputs, approvals, integrations, and core project workflows.
| Account | Eligible / active now | Actions | Top user previous → current | Top two | Areas |
|---|---|---|---|---|---|
| Atlas Labs | 12 / 6 | 240 | 27% → 24% | 46% | 3 of 4 |
| Northstar Works | 14 / 4 | 260 | 69% → 78% | 89% | 4 of 4 |
| Beacon Systems | 11 / 6 | 180 | 59% → 61% | 74% | 3 of 4 |
| Meridian Group | 20 / 5 | 220 | 38% → 72% | 83% | 4 of 4 |
| Harbor Analytics | 8 / 5 | 150 | 40% → 38% | 67% | 3 of 4 |
Atlas distributes Reporting across analysts, a manager, and a viewer. Northstar has the highest total and full area breadth, yet one analyst produces 203 of 260 actions and three other active users are light viewers. That merits a permissions, role, and workflow review—not a churn claim.
Beacon's 61% may fit administrator-led Integrations if downstream operators receive value and backup maintenance exists. Meridian is the clearest change signal: active users fell from 11 to five while concentration rose 34 percentage points after the prior champion became inactive. Harbor has lower volume but two stable workflow owners and broader role coverage.
Northstar Works
Lead analyst
owns every area
Second analyst
partial workflow
Viewer
consumes outputs
Viewer
consumes outputs
10 eligible users
no activity at all
Top user
78.1%
69% → 78%, +9 points
Top two
89.2%
second user only 11.2%
Active of eligible
4 / 14
28.6% coverage
Core workflow completers
2
of four active people
What none of this proves
That the second analyst could take over, that the account is at risk, or that anyone is dissatisfied. It sets the agenda for a permissions, role, and workflow review.
Northstar's distribution makes the calculation auditable. The leading analyst has 203 actions, the next analyst 29, and two viewers contribute 17 and 11. The four shares are 78.1%, 11.2%, 6.5%, and 4.2%; together they sum to 100%. The account has four active people, but only two produce substantial workflow output.
| Evidence | Observed result | Interpretation limit |
|---|---|---|
| Top-one / top-two share | 78.1% / 89.2% | The second user's 11.2% does not prove they can take ownership. |
| Active / eligible users | 4 / 14, or 28.6% | Eligibility may include roles that only consume outputs. |
| Product-area breadth | 4 of 4 | Most breadth can still belong to the same analyst. |
| Core workflow completers | 2 | Completion does not reveal permissions, knowledge, or willingness. |
| Current versus prior top-one | 78% versus 69% | The nine-point rise needs numerator and contributor-level review. |
How should trend, roles, and backup coverage be read?
Calculate percentage-point change as current concentration - previous concentration. Keep both values visible. A rise can come from the top user doing more, other people doing less, a changed denominator, automated activity, or cadence.
Review stable totals with fewer active users, a disappearing second contributor, stable breadth owned by fewer people, or a temporary spike during onboarding, migration, or close. Use equal completed periods that match the workflow cadence.
| Observable evidence | What it suggests | Still unknown |
|---|---|---|
| Another person completes the core workflow across periods | Recurring secondary ownership | Ability to lead or teach |
| Permissions are distributed | Setup is not locked to one identity | Configuration knowledge |
| Several roles use critical areas | Value creation or consumption is distributed | Whether roles are interchangeable |
| Activity continues while the primary user is inactive | Observed operational continuity | Why the user is absent and how long continuity lasts |
Use “backup contributor” or “possible backup champion” until the customer confirms knowledge, authority, influence, and willingness. More users is not the goal by itself; the account needs role-appropriate coverage to configure, operate, analyze, approve, and consume the workflow.
How should you set concentration review thresholds?
There is no defensible universal percentage. Set review thresholds from the workflow's expected ownership model, eligible roles, typical account size, lifecycle, and historical distribution. A billing administrator at 90% may be normal; a team commenting workflow at 90% may merit immediate investigation.
- Choose one meaningful activity definition and one entity grain.
- Build a comparable cohort by workflow, plan, account size, lifecycle, and role mix.
- Inspect the full distribution, sample size, median, quartiles, and recent account history.
- Define a review rule using both level and change, such as high top-one share plus falling contributor count.
- Backtest the queue against raw users, workflows, selected Visits, and known account context.
- Version the threshold and monitor how many accounts it flags.
| Review condition | Why it is stronger than one cutoff |
|---|---|
| Top-one share rises while active contributors fall | Shows redistribution rather than only a high static level. |
| Top-two share is high and the second contributor disappears | Detects loss of the only visible secondary participant. |
| Critical workflow has one qualified completer across several expected periods | Ties the alert to operational coverage and cadence. |
| Concentration is high, breadth is broad, and one user owns nearly every area | Distinguishes account breadth from distributed ownership. |
Use the threshold to prioritize a human review, not to assign risk automatically. Publish the underlying count, numerator, denominator, window, cohort, and reasons so an account team can challenge the flag.
Monitor alert yield as well as statistical distribution. If a rule flags most accounts, it is not prioritizing; if it flags almost none, it may miss meaningful change. Review a sample of flagged and unflagged accounts and record whether the underlying workflow evidence justified follow-up.
How do you investigate and act on concentration?
- Define meaningful activity and exclude automation, staff, support, demo, and test traffic.
- Define expected roles and eligible users instead of defaulting to every seat.
- Calculate top-one, top-two, active-user coverage, and product-area distribution.
- Compare equal periods and inspect which numerator or denominator changed.
- Map critical workflows, permissions, and outputs to named users.
- Review selected Visits around completed and abandoned attempts.
- Confirm the organizational explanation with the account before acting.
Possible actions include inviting a second administrator, transferring permissions, documenting a workflow, onboarding an adjacent role, sharing outputs more broadly, or fixing a barrier that blocks participation. Do not push broad adoption into an intentionally specialist workflow.
In Hymetry, start in Companies, inspect product-area usage, identify contributors in Users, and open relevant Visits. The path keeps the activity definition, period, shares, users, areas, and session evidence inspectable. See also the guide to measuring product usage by company.
Frequently asked questions
What is champion concentration risk?
The possibility that healthy-looking account usage depends heavily on one person. It is an investigation signal, not a diagnosis.
What is the difference between a champion and a power user?
A power user has high observed usage. A champion also promotes or leads adoption, which behavior alone cannot establish.
What is a good top-user concentration?
There is no universal threshold. Compare role, workflow, eligible population, lifecycle, trend, and top-two share.
Which activity belongs in the formula?
Use the closest observable proxy to value—completed workflows, meaningful actions, active days, or role-appropriate area use—with documented exclusions.
Should I calculate top-one or top-two concentration?
Use both. One shows leading-user dependence; the other shows whether a substantial second contributor may exist.
Can analytics identify a backup champion?
It can identify backup-ownership evidence, but a customer conversation must confirm knowledge, authority, influence, and willingness.
Does high concentration mean churn?
No. It can reflect healthy specialization, rollout, transition, or fragile dependency; renewal depends on evidence beyond product behavior.
Sources
Methodology and limitations
Champion research informs the role definitions but is not treated as a B2B SaaS churn benchmark. The concentration formulas, fictional data, calculations, decision workflow, and visuals are original applications. No universal SaaS threshold is claimed.
Source directory
- Hymetry demo Companies view
- Hymetry demo Users view
- Hymetry workflow for customer-success teams
- Guide to building an interpretable customer health score
- Howell and Higgins, “Champions of Technological Innovation”
- Shea, conceptual model of innovation champions
- Pettersen, Eide, and Berg review of technology champions
- U.S. Department of Justice HHI explanation
- UK Office for National Statistics guidance on percentage points
- Mixpanel group analytics documentation
- Mixpanel reports overview
- Mixpanel user-engagement guide
- Twilio Segment Group specification
- PostHog group analytics documentation
- PostHog product analytics best practices
- Hymetry Companies documentation
- Hymetry Users documentation
- Hymetry Pages documentation
- Hymetry Visits documentation