Define product areas around customer jobs
A product area is a stable analytical grouping of related capabilities that support one meaningful job, such as Reporting, Collaboration, Integrations, or Administration. It sits above individual routes and controls but below the entire product.
Do not copy navigation blindly. One area may span several menus, and one screen may support several workflows. Prefer a durable hierarchy:
- Product area: the capability or customer job.
- Grouped pages or features: the inspectable parts of that capability.
- Normalized pages: dynamic URLs mapped to stable identities.
- Meaningful events: actions that show progress or completion.
Product area
the customer job you report on
Reporting
Build, share and schedule the numbers a customer runs on
Grouped features
the inspectable parts — breadth is counted here
Normalized pages
dynamic URLs mapped to one stable identity
Meaningful events
what makes an account count as adopting
Roll up for the rate, keep every layer underneath for the diagnosis. Navigation is not the hierarchy — one area can span several menus.
For Reporting, the area may include the reports list, builder, report detail, scheduling, and exports. Dynamic paths such as /reports/123 should normalize to one stable page identity, while events such as report created, export completed, or schedule saved represent progress. Preserve raw routes and event evidence underneath the grouped view so a team can audit the mapping.
A feature may serve more than one area. A shared permission control might support Administration and Integrations, for example. Either assign a primary area plus documented secondary relationships or allow explicit overlap while preventing the same activity from being added twice to a product-wide total.
Choose a meaningful adoption threshold
Choose the weakest behavior that still represents the analytical question. A team may need several named states instead of one universal adopted/not-adopted flag.
| Threshold | What qualifies | Use it for |
|---|---|---|
| Reach | An eligible account visits at least one area page | Discovery and exposure, not completed value |
| Meaningful action | An eligible user completes a named action such as creating, exporting, scheduling, or syncing | Initial workflow adoption |
| Multi-feature | The account adopts a required number of grouped features | Breadth within a complex area |
| Workflow completion | A defined sequence reaches a valid outcome | End-to-end progress |
| Recurring | Qualifying use occurs in the required number of distinct periods | Persistence beyond first use |
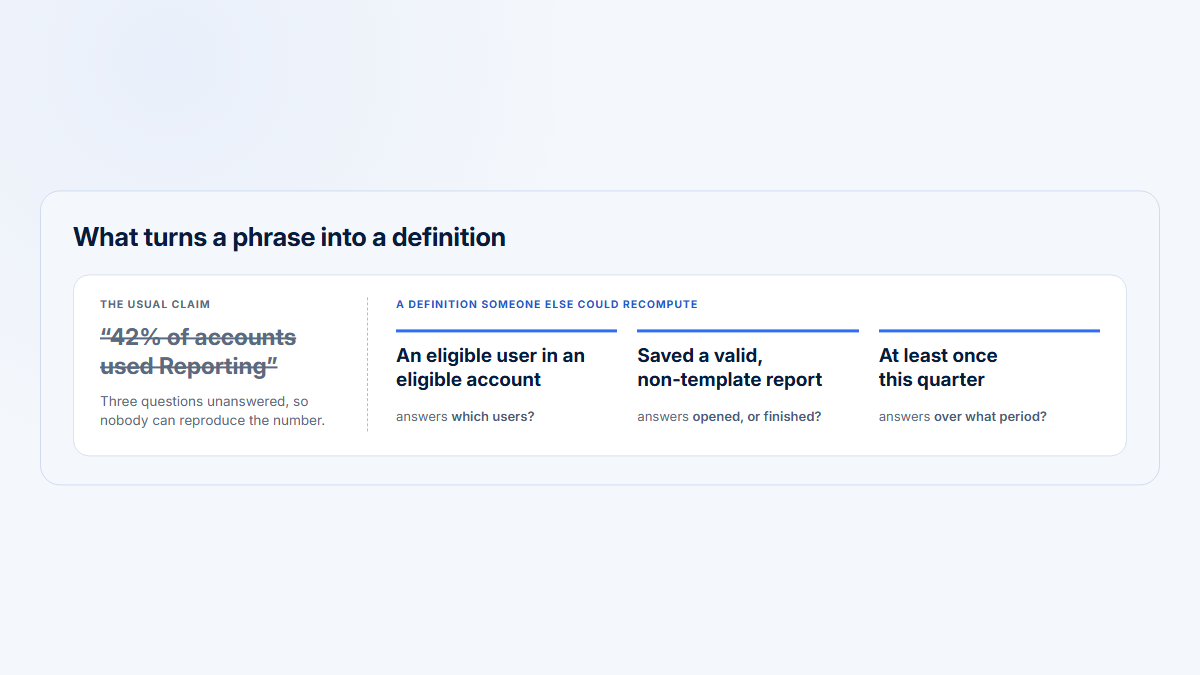
Match cadence to the job. Weekly collaboration may require activity in multiple weeks; a monthly integration sync or a quarterly administration task should not be judged by a weekly rule. Document plan, role, setup, and lifecycle eligibility before examining results.
Keep reach and adoption as separate states when discovery matters. A team can then distinguish an area that nobody encounters from one that many accounts visit but few complete. When an area has several valid outcomes, use a small approved set rather than forcing every customer through one path.
Write a reusable threshold record
Write the rule as a reusable record: area ID and label; eligible plans, lifecycle states, and roles; included grouped features; qualifying events; minimum count or sequence; observation period; recurring cadence; exclusions; rule version; and effective date. Review the rule with product, analytics, and customer-facing owners before publishing a dashboard.
Thresholds should remain decision-oriented. If the question is discoverability, reach is enough. If the team is deciding whether onboarding produces progress, require a meaningful action. If it is evaluating habit, require recurrence. Do not choose the threshold that produces the most flattering rate.
Calculate the core metrics
Count distinct entities across the complete selected period. Do not add daily uniques to estimate monthly accounts or users.
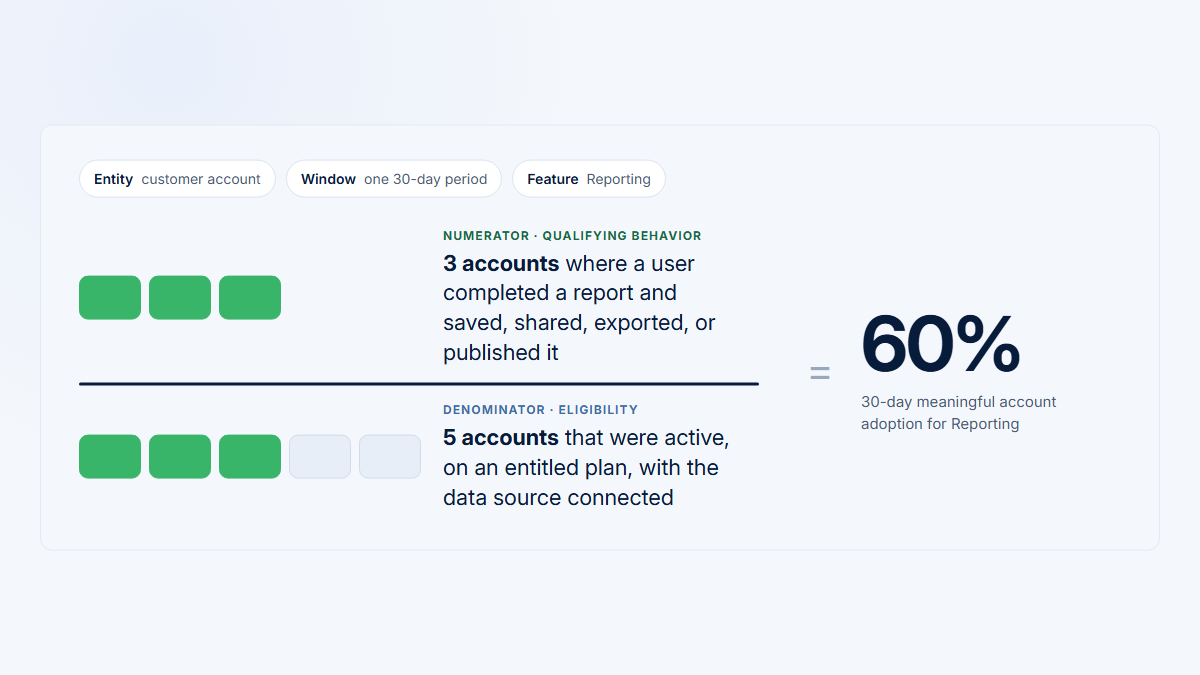
Account product-area adoption rate
Account product-area adoption rate
= eligible active accounts meeting the area-adoption threshold
÷ eligible active accounts
× 100
User penetration within adopting accounts
User penetration within adopting accounts
= distinct users using the product area
÷ active users within the accounts that adopted the area
× 100
Area breadth for an account
Area breadth for an account
= grouped features adopted in the area
÷ relevant grouped features available to the account
× 100
Recurring area adoption
Recurring area adoption
= accounts using the area in the required number of distinct periods
÷ accounts that initially adopted the area
× 100
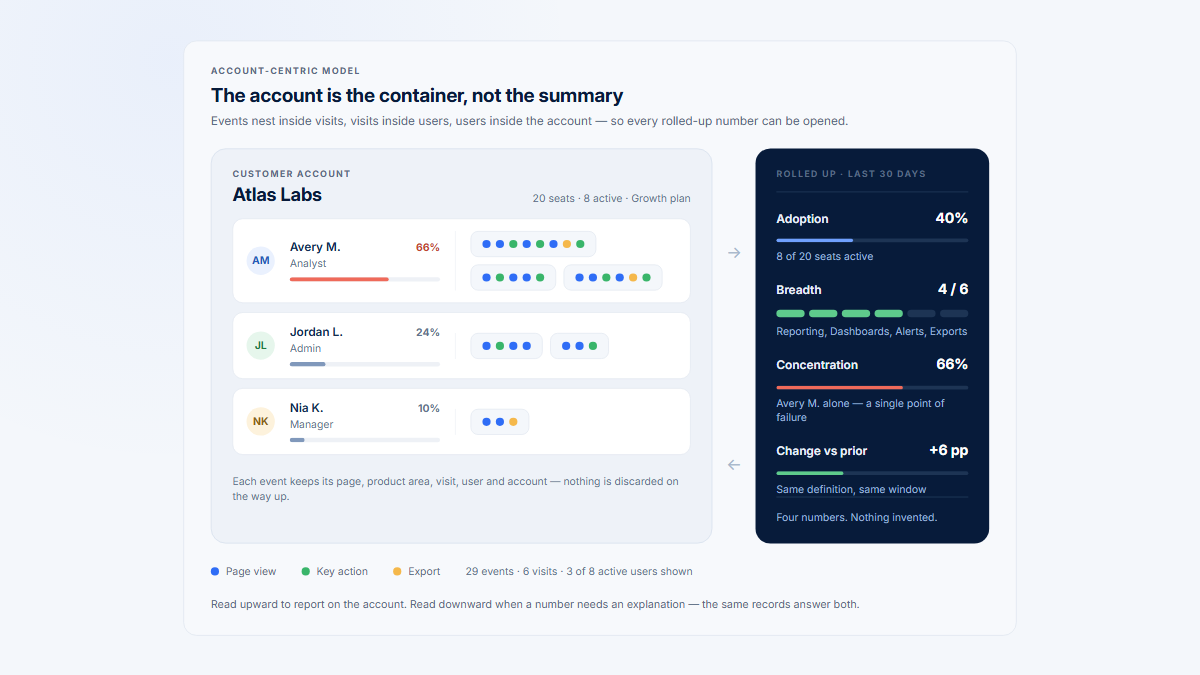
Optionally track top-user concentration using one clearly labeled activity basis: the account's area activity from its top user divided by total area activity. High concentration may be appropriate for specialist work or fragile for a collaborative workflow; the metric cannot decide which without role context.
Worked example: Reporting across five accounts
This example is fictional and illustrative. Reporting contains five grouped features. An account is eligible when its plan includes Reporting and setup is complete. Meaningful adoption requires creating, exporting, or scheduling a report; recurring adoption requires meaningful use in at least two distinct weeks in a 30-day window.
| Account | Eligible | Reach | Meaningful actions | Features adopted | Active / Reporting users | Status |
|---|---|---|---|---|---|---|
| Atlas Labs | Yes | Yes | 8 | 4 of 5 | 6 / 4 | Recurring |
| Northstar Works | Yes | Yes | 1 | 2 of 5 | 4 / 1 | Initial adoption |
| Beacon Systems | Yes | Yes | 0 | 0 of 5 | 5 / 2 | Reach only |
| Meridian Group | No | No | 0 | Not relevant | 7 / 0 | Excluded |
| Harbor Analytics | Yes | No | 0 | 0 of 5 | 3 / 0 | Not adopted |
- Meaningful account adoption: 2 ÷ 4 × 100 = 50%.
- Reach: 3 ÷ 4 × 100 = 75%. The 25-point gap separates encounter from action.
- User penetration in adopting accounts: 5 ÷ 10 × 100 = 50%.
- Atlas Labs breadth: 4 ÷ 5 × 100 = 80%.
- Recurring adoption: 1 recurring account ÷ 2 initial adopters × 100 = 50%.
The same headline rate leads to different investigations. Atlas Labs may have one relevant feature gap; Northstar depends on one Reporting user; Beacon reached pages without qualifying action; Harbor needs an eligibility and relevance check; Meridian remains outside the denominator.
The example also shows why averages need distribution. Reporting is adopted in half of eligible accounts, yet only one of two adopters is recurring and Northstar's activity is entirely concentrated in one user. Those are different operational questions: acquisition into the area, repetition, and resilience inside the account.
Reporting
Collaboration
Integrations
Administration
Atlas Labs
Northstar Works
Beacon Systems
Harbor Analytics
Meridian Group
- Recurring — qualifying use in two distinct weeks
- Initial — one meaningful action
- Reach only — visited, never acted
- Not adopted
- Not eligible — outside the denominator
Each column uses its own eligibility, threshold and cadence. A monthly integration sync should never be judged by Collaboration's weekly rule.
Reporting · 30-day window
Reach
Did anyone encounter it?
75%
3 of 4 eligible accounts
Meaningful adoption
Did anyone do the work?
50%
2 of 4 eligible accounts
Breadth in adopters
How much of the area do they use?
60%
avg of 5 grouped features
User penetration
How far inside the account?
50%
5 of 10 active users
Recurrence
Did it stick past the first time?
50%
1 of 2 initial adopters
Not one funnel
Five denominators, five questions. The three 50% figures count different things — never average them into an area score.
Connect account adoption to user and Visit evidence
Account reach alone can hide whether a workflow is broad, role-appropriate, or dependent on one champion. For each adopting account, inspect eligible users, roles, user penetration, top-user concentration, and which grouped features contribute. Then open selected Visits only when a specific aggregate question remains.
| Layer | Question | Example next step |
|---|---|---|
| Product area | Which customer capability is adopted? | Compare eligible accounts and periods |
| Grouped feature | Which parts of the area are reached or completed? | Find breadth gaps and prerequisites |
| Company | Which accounts contribute to the rate? | Inspect plan, lifecycle, and baseline |
| User | Who performs the work? | Check roles, distribution, and concentration |
| Visit | What happened in a selected workflow? | Compare successful and incomplete evidence |
Adoption does not prove satisfaction, realized value, health, renewal, or causality. Use it to route investigation and connect behavior with customer-confirmed outcomes.
Area breadth must stay distinct from product-wide breadth. Four of five Reporting features is 80% breadth inside Reporting; it says nothing about Collaboration, Integrations, or Administration. Likewise, depth such as repeated exports or engaged time should not be merged into breadth unless a transparent composite is genuinely needed.
Implement and govern the model
- Map customer jobs and define a small set of stable areas.
- Assign grouped pages, normalized routes, and meaningful events.
- Define eligibility by plan, role, setup, and lifecycle.
- Choose initial and recurring thresholds for each area.
- Match periods to expected workflow cadence.
- Calculate account reach, penetration, breadth, and recurrence.
- Validate definitions against known workflows and selected Visits.
- Version material taxonomy changes and record effective dates.
Keep stable identifiers separate from display labels. If a feature moves, a rule changes, or an area splits, choose a history strategy deliberately: preserve historical definitions, backfill when defensible, or create a clearly dated discontinuity. Never move features silently and compare the trend as if its meaning were unchanged.
Visualize each question directly: bars for account adoption by area, an account-by-area matrix for portfolio scanning, profiles for reach/adoption/breadth/penetration/recurrence, and trend lines only when definitions remain comparable. Label eligibility and thresholds near the chart so the audience can interpret the denominator.
How Hymetry supports product-area analysis
Hymetry connects product areas and grouped Pages with Companies, Users, and Visits. Teams can scan account adoption, drill into the people contributing to it, and inspect selected session evidence without treating replay as the aggregate metric.
The product model supports an inspectable chain from area-level signal to company, user distribution, grouped page, and Visit. The analytical definitions—eligibility, threshold, cadence, and business interpretation—still belong to the team.
Frequently asked questions
What is product-area adoption?
It is the share of eligible active accounts that meet a defined threshold for a coherent product capability during a stated period.
How is product-area adoption different from feature adoption?
Feature adoption measures one capability; area adoption combines related features and events around a larger customer job while retaining the feature layer for diagnosis.
Should product areas match the navigation menu?
Only when navigation mirrors stable customer jobs. Otherwise define analytical areas independently and map routes to them.
Can one feature belong to more than one product area?
Yes when it genuinely supports several jobs, but document the overlap and avoid silently adding overlapping counts into a product-wide total.
What denominator should I use?
Eligible active accounts: customers that could realistically use the area during the period after plan, role, setup, lifecycle, and valid-activity rules are applied.
How should low-frequency areas be measured?
Use a longer window and recurrence rule that matches the real cycle, such as monthly or quarterly administration, rather than forcing weekly activity.
Does product-area adoption prove customer value?
No. It proves only that the stated behavior occurred. Confirm outcomes and meaning through customer, operational, support, and qualitative evidence.