Pages analytics
See which parts of your product are actually adopted.
Pages turns raw product activity into clear product areas, page-level metrics, flows, and action signals — so you can understand what users rely on, where adoption stalls, and what needs attention.
Explore a sample SaaS project. No credit card required.
Automatic product structure
Turn raw product paths into clean page groups.
Hymetry turns noisy product paths into clean page groups your team can analyze. Raw URLs stay available for inspection, while reporting uses product areas and grouped pages.
Raw URLs
/projects/128/tasks/team/settingsPage rules
Normalize pathsMatch examplesGrouped pages
DashboardBillingAPI keysProduct areas
Core productAdministrationDeveloperProduct areas explain broad distribution. Grouped pages power adoption, engagement, trend, company, and user comparisons. Raw URLs are reserved for action-level evidence.
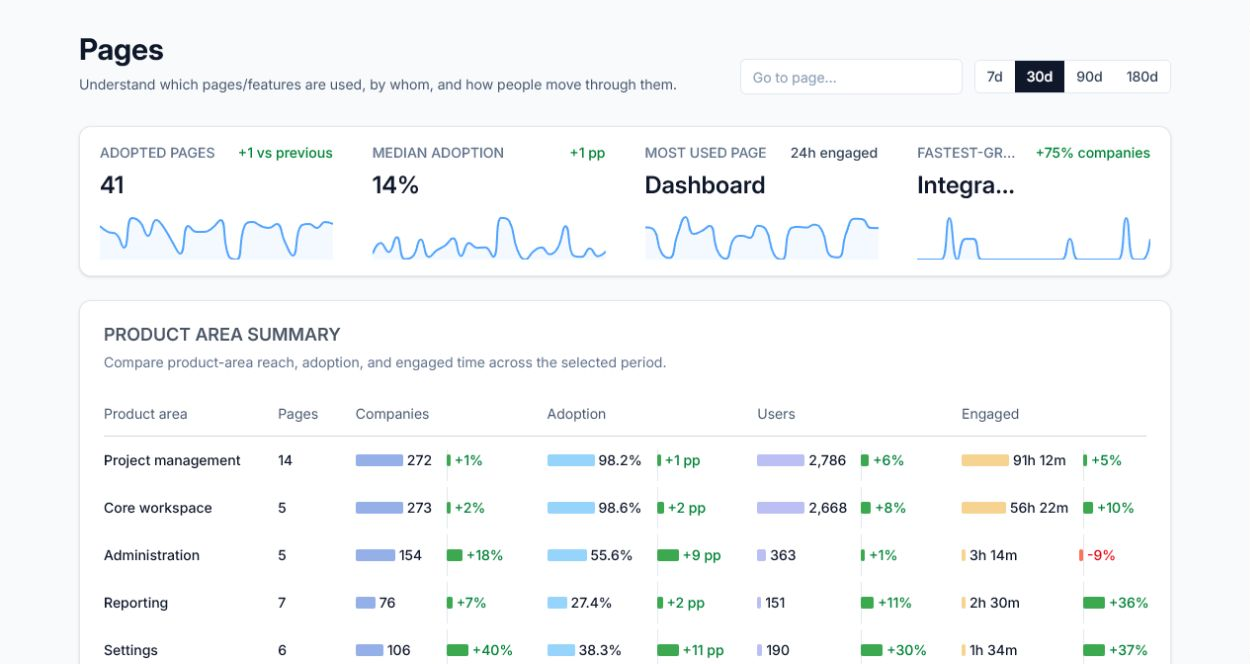
See which pages are actually adopted.
Start with a calm overview of the product map: how many grouped pages have adoption, where median adoption sits, which page carries the most engagement, and which page is gaining momentum.
Median adoption
14%+1ppMost used page
Dashboard24h engagedFastest-growing
Integration detail+77% companiesOverview first, investigation second
Use the overview to decide what changed, then open a grouped page when the signal needs company, user, flow, or raw-action evidence.
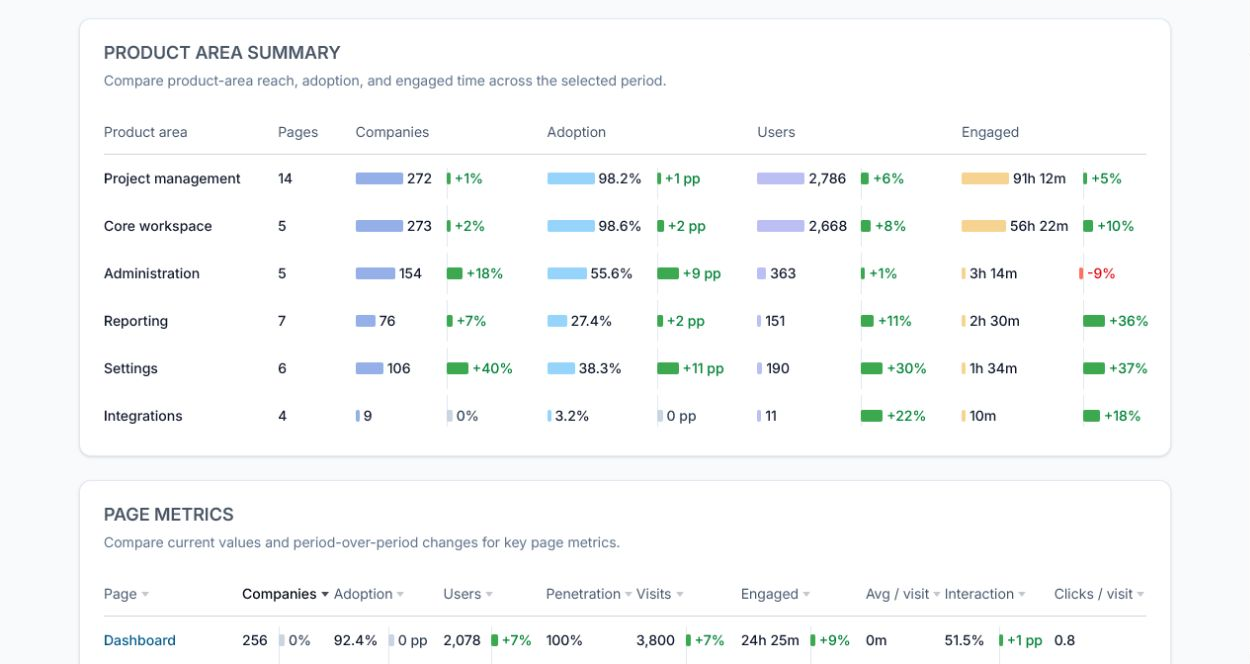
Flagship table
Compare grouped pages by adoption, engagement, and interaction.
The main Pages table stays at the grouped page or feature level. Sort by companies, adoption, users, visits, engaged time, interaction, or trend without mixing raw URL actions into the same view.
| Grouped page | Companies | Adoption | Users | Penetration | Visits | Engaged | Interaction | Trend |
|---|---|---|---|---|---|---|---|---|
| Dashboard | 258 | 92.4% | 2,078 | 100% | 3,800 | 24h 25m | 61.5% | +9% |
| Task details | 250 | 90.3% | 1,718 | 100% | 2,232 | 23h 42m | 61.7% | +5% |
| My work | 243 | 87.3% | 1,606 | 100% | 2,552 | 17h 4m | 53.5% | +7% |
| Project overview | 239 | 85.2% | 1,481 | 100% | 2,251 | 16h 18m | 56.6% | +3% |
| Project list | 225 | 84.8% | 1,244 | 100% | 1,936 | 14h 24m | 56.1% | +2% |
| Notifications | 197 | 67.5% | 812 | 100% | 967 | 6h 12m | 50.4% | -1% |
| Search | 158 | 57.4% | 508 | 100% | 560 | 3h 4m | 48.7% | +1% |
Compare adoption, engagement, and interaction.
Use one comparison view to switch between adoption, visits, engaged time, and interaction. The chart shows how grouped pages change over time; the summary rows call out what deserves attention.
AdoptionVisitsEngaged timeInteraction
Core workspace
Dashboard24h
Dashboard24h
Project management
Task details23h
Task details23h
Core workspace
My work17h
My work17h
Project management
Project overview16h
Project overview16h
Project list14h
Reporting
Reports6h
Reports6h
Administration
Team4h
Team4h
Settings3h
Integrations
Integration detail2h
Integration detail2h
Understand where users spend time.
Product-area distribution shows where engaged time concentrates. The parent level is the product area; the child level is the grouped page or feature inside it.
Readable areas, readable pages
The treemap answers where attention goes without forcing teams to scan raw paths or tiny URL labels.
See how users move between pages.
Pages connects grouped product flows with raw-page actions. The flow shows common movement between grouped pages; the action panel shows specific normalized URLs and elements when you need evidence.
Product flow: grouped pages
Understand account and user context.
Page adoption becomes useful when teams can see whether usage is broad, shallow, concentrated in a few accounts, or led by a small set of power users.
Dashboard adoption by account
Avg engaged time / userShallowAtlas LabsBlue NorthDriftwood Labs
Active usersHigh
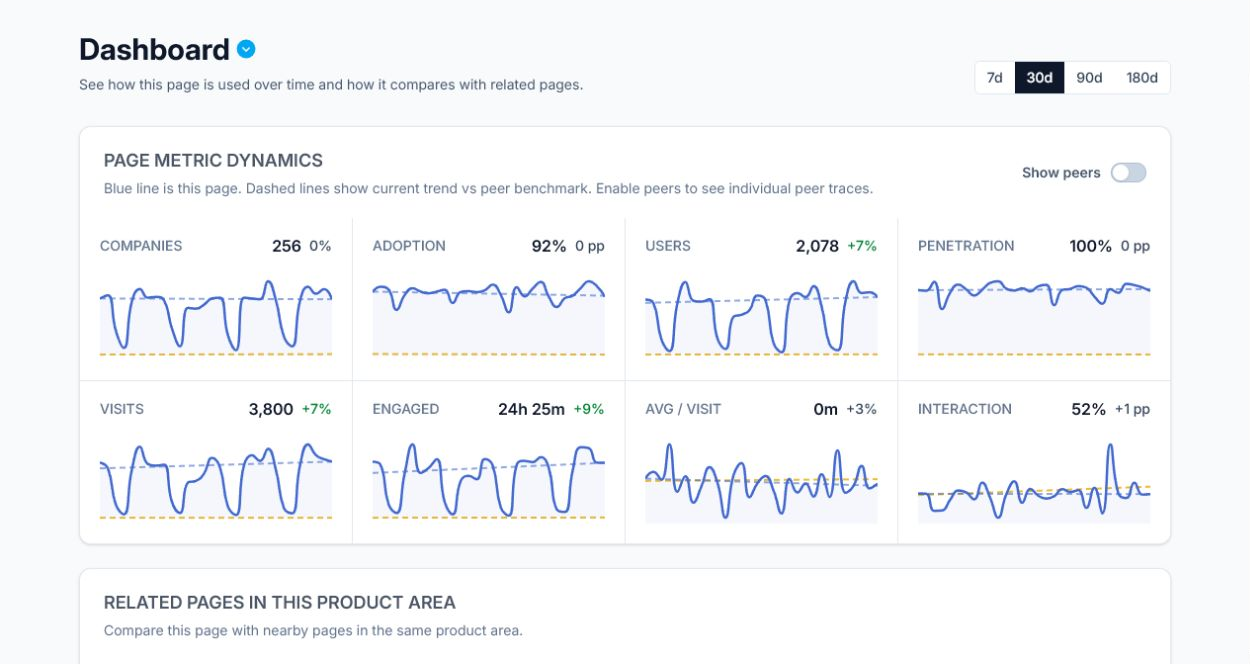
Page detail
Open the evidence behind every page signal.
When a grouped page stands out, open its detail view to see who uses it, which companies adopted it, how engagement changed, where users came from, and which raw-page actions happened.
Recommendations
Turn page usage into product action.
Pages gives product, customer success, and research teams a short list of signals to act on instead of another analytics backlog.
Investigate low interaction on Search.
Search has steady adoption but lower interaction quality than nearby core pages. Review the flow into Search, inspect raw-page actions, and compare shallow accounts against deeply engaged ones.
Pages connects to the rest of Hymetry.
Move from page signals into account adoption, user behavior, and visit-level context when a finding needs follow-up.
See which parts of your product are working.
Explore a demo project first, then create your workspace when you’re ready.
No credit card required.