Start with the decision and release population
Write the decision first: expand rollout, change onboarding, fix the workflow, alter targeting, or stop investing. Then define the populations that make that decision measurable.
| Population | Definition | Question |
|---|---|---|
| Eligible | Accounts or users with access, permission, prerequisites, need, and realistic opportunity | Who could benefit? |
| Exposed | Eligible entities that received the release under a documented rule | Who received the experience? |
| Discovered | Exposed entities that reached the feature or entry point | Who found it? |
| Adopting | Entities completing the predefined meaningful behavior | Who used it in the way that matters? |
Eligibility can depend on plan, role, permission, prerequisite state, lifecycle, region, application version, rollout group, and whether the account has the data or workflow required. Exposure may mean technical enablement, the first eligible Visit after enablement, or actual encounter with an entry point. State which one you use.
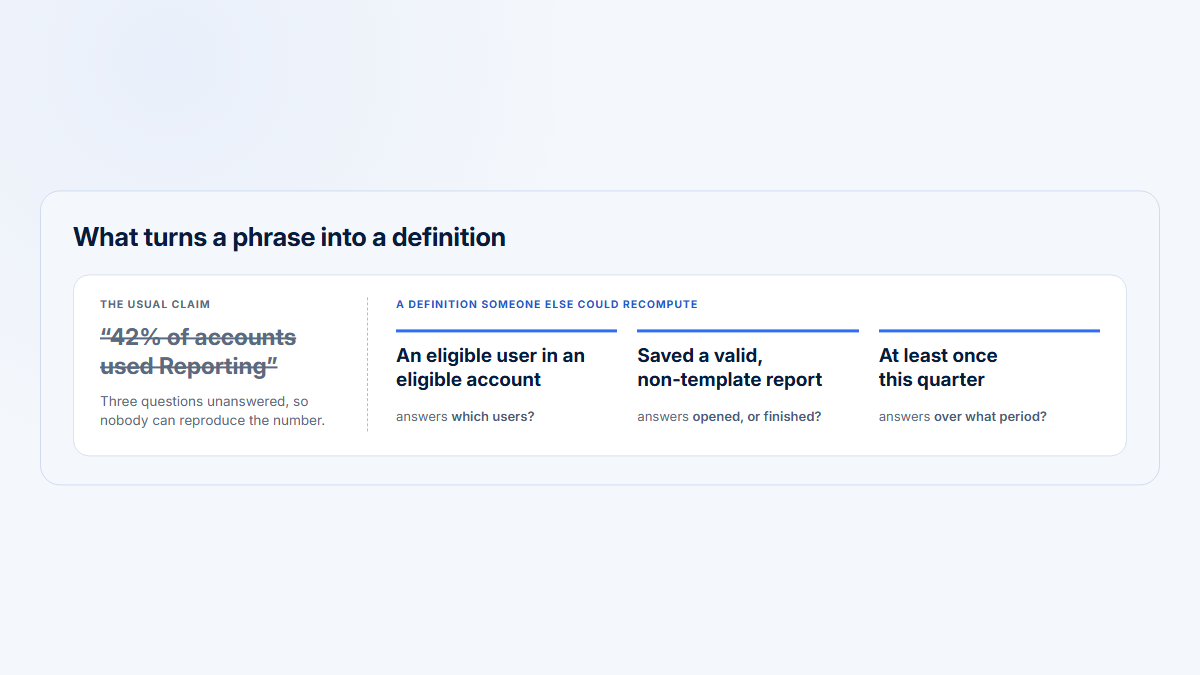
A page view can support discovery but rarely proves adoption. Define meaningful use as a successful workflow, durable state, output, repeated behavior, or distribution rule tied to the feature’s intended job. The meaningful feature use guide helps choose that threshold.
Release measurement contract
Before launch, record the decision, primary entity, eligible and excluded populations, exposure event, discovery signal, meaningful completion, recurrence and distribution rules, occurrence timestamps, identity and account context, maturity window, comparison design, and guardrails. Identify one product owner and one technical owner.
Specify feature-flag, application-version, permission, prerequisite, and account-lifecycle fields required to reconstruct opportunity. Define how account switching, multi-account users, delayed server jobs, retries, and automated actors are handled. List the authoritative product records used to validate outcomes and the event or route changes that would require a metric version.
Finally, state the claims the design can and cannot support. A descriptive cohort can support “30% of mature exposed accounts repeated the workflow”; it cannot support “the release caused a 30% improvement” without a credible causal comparison.
Align measurement to exposure and workflow cadence
A public launch date does not give every account the same opportunity. Feature flags, staged rollouts, version adoption, permissions, regions, and account-by-account enablement produce different Day 0 dates.
Days since exposure
analysis date − first eligible exposure date
Compare equivalent time since exposure: Day 0–7, 8–14, 15–28, or another window that includes realistic opportunities. Exclude cohorts that have not matured enough for the recurrence rule. For a monthly deadline, align the window to that opportunity; for a one-time setup, measure valid completion and downstream success; for daily operations, require distinct active days rather than raw event counts.
Measured by calendar date
Every account gets a different amount of opportunity
Account D looks like a non-adopter. It has had five days.
Measured from each account's Day 0
Equal windows, comparable rates
Account D is not yet mature and is excluded from the rate, not counted as a failure.
A launch date is not an exposure date. Flags, versions, permissions and regions give every account its own Day 0.
Build a post-release adoption funnel
Eligible → Exposed → Discovered → Started → Completed → Repeated → DistributedExposure rate
eligible entities exposed ÷ eligible entities × 100
Discovery rate
entities discovering the feature ÷ eligible exposed entities × 100
Start rate
entities starting the workflow ÷ entities discovering the feature × 100
Meaningful adoption rate
entities completing the behavior ÷ mature eligible exposed entities × 100
Completion rate
entities completing ÷ entities starting × 100
Repeated-use rate
initial adopters meeting recurrence ÷ initial adopters with enough follow-up × 100
Distributed-adoption rate
recurring adopters meeting the user-distribution rule ÷ recurring adopters × 100
Keep the entity consistent throughout a funnel. Label account and user metrics explicitly; never divide adopting accounts by eligible users. A large discovery rate with weak completion suggests a different product problem from low exposure.
One entity per funnel
Never divide adopting accounts by eligible users. Label every stage account-level or user-level and keep it that way to the bottom.
Measure accounts, users, and concentration separately
Account adoption
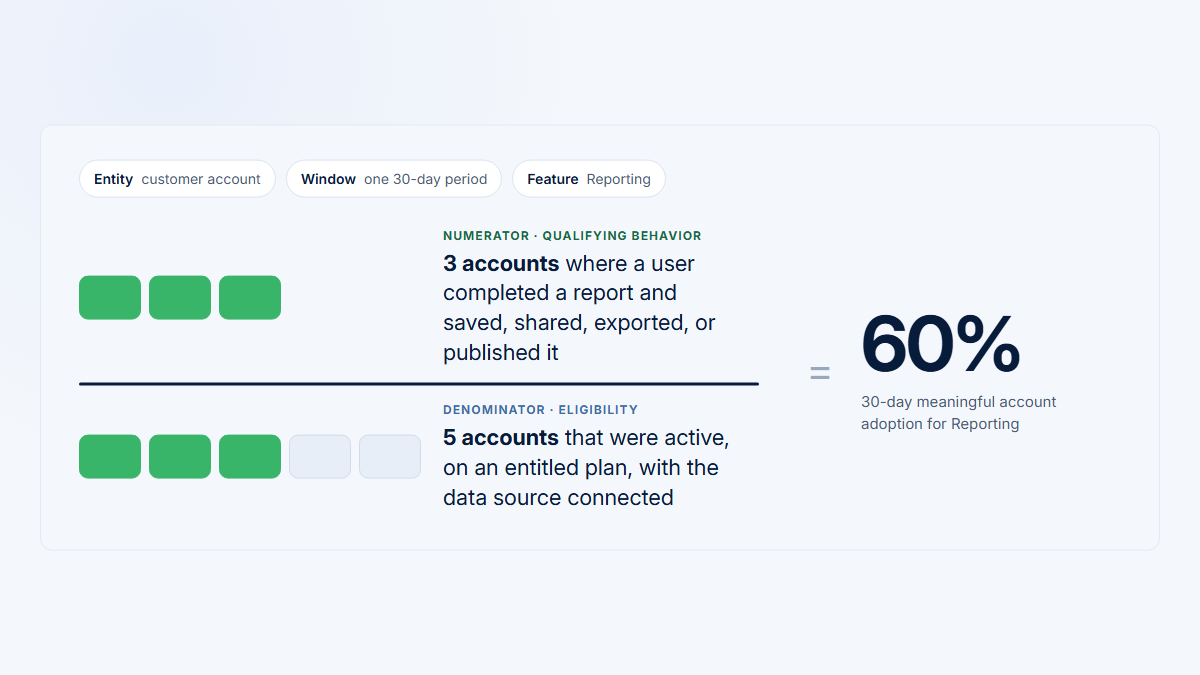
adopting eligible accounts ÷ eligible exposed accounts × 100
User adoption
adopting eligible users ÷ eligible exposed users × 100
User penetration
adopting users in adopting accounts ÷ eligible active users in those accounts × 100
Top-user concentration
actions performed by each account’s primary user ÷ all qualifying actions in adopting accounts × 100
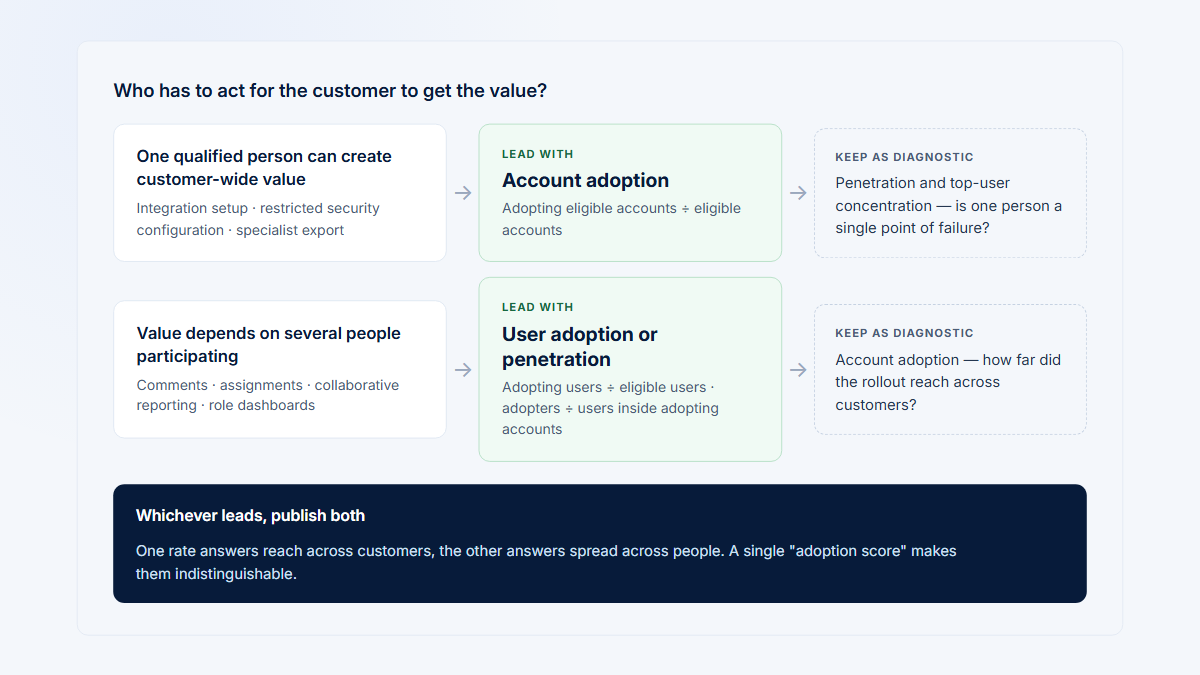
Account adoption is often the commercial B2B unit. User adoption and penetration show whether use spreads beyond a champion. Concentration is not automatically bad: one administrator may correctly own setup, while a collaborative release may require several participants. Report the median per-account concentration as well as a global weighted value so one large account does not dominate.
Choose a comparison design and describe change correctly
| Method | Useful when | Main limitation |
|---|---|---|
| Equal pre/post | Existing workflow and comparable periods | Seasonality, trend, account mix, and other changes |
| Exposure cohorts | Staged, role-gated, regional, or version rollout | Cohorts can still differ in other ways |
| Randomized holdout | Assignment and exposure can be controlled | Needs power, trustworthy assignment, guardrails, and often account-level randomization |
| Matched comparison | Randomization is unavailable | Unobserved differences remain |
| Interrupted time series | Many observations around one clear intervention | Trend, seasonality, autocorrelation, and concurrent changes need modeling |
| Visit comparison | Explaining successful and failed paths | Qualitative evidence does not estimate prevalence |
A pre/post difference shows that behavior changed; it does not by itself prove the release caused the change. Hymetry does not run randomized experiments automatically.
| Observed pattern | Likely question | Population check | Evidence to inspect |
|---|---|---|---|
| Low exposure | Rollout, flag, version, permission, or return-to-product problem? | Was “eligible” defined too broadly? | Flag assignments, versions, eligible Visits |
| Exposure high, discovery low | Entry point or communication problem? | Did exposed users actually encounter the surface? | Navigation paths and cohort-specific Visits |
| Discovery high, start low | Value proposition, permission, or prerequisites? | Were viewers legitimate intended users? | Roles, prerequisite state, page evidence |
| Start high, completion low | Workflow friction, validation, or technical failure? | Are retries inflating starts? | Error outcomes, product records, stalled Visits |
| Completion high, recurrence low | One-time job, weak outcome, reliability, or wrong cadence? | Has enough follow-up elapsed? | Opportunity cycles and downstream outcomes |
| Account adoption high, penetration low | Intended specialist ownership or incomplete rollout? | Are eligible roles correct? | Per-account users and concentration |
Percentage change
(new count − old count) ÷ old count × 100
Percentage-point change
new rate − old rate
If adoption rises from 21.7% to 30.0%, the change is +8.3 percentage points. The relative increase in the rate is about 38.2%. Name which one you report.
Worked example: Scheduled Reports
A staged release must decide whether to expand, change onboarding, or fix setup. The primary entity is an eligible customer account. Exposure is rollout-flag enablement. Initial adoption is one schedule saved successfully. Recurring adoption requires two successful scheduled outputs in distinct weeks within 28 days. Guardrails include setup failures, output failures, and displacement of existing delivery.
120 active accounts
80 initially classified eligible
60 exposed
42 discovered
30 started setup
24 completed and saved
18 repeated in two weekly periods
12 recurring adopters had multiple participating users| Metric | Calculation | Result |
|---|---|---|
| Exposure | 60 ÷ 80 | 75.0% |
| Discovery | 42 ÷ 60 | 70.0% |
| Start among discoverers | 30 ÷ 42 | 71.4% |
| Completion | 24 ÷ 30 | 80.0% |
| Initial account adoption | 24 ÷ 60 | 40.0% |
| Recurring account adoption | 18 ÷ 60 | 30.0% |
| Distributed among recurring adopters | 12 ÷ 18 | 66.7% |
Do not call this “70% adoption”: 70% is discovery. Among 420 initially eligible exposed users, 56 participate, so user adoption is 13.3%. Inside completing accounts, 56 of 200 eligible users participate, or 28.0% penetration. Primary users generate 126 of 180 qualifying actions, or 70.0% concentration.
An announcement increases page Visits from 90 to 168—an 86.7% rise—while completed schedules remain 12. Reach improved without completion. The next question is permission, prerequisite, understanding, or workflow failure.
Correct eligibility and compare displacement
An eligibility audit finds ten onboarding accounts lacked a verified recipient or data source. Correct eligible exposed accounts from 60 to 50; recurring adoption becomes 18 ÷ 50 = 36.0%. Record the definition change rather than silently overwriting the old result.
A comparable old email workflow had 13 recurring accounts out of 60, or 21.7%. Scheduled Reports has 18 of 60, or 30.0%: an 8.3-point difference and a 38.5% relative rise in adopter count. Report the observed difference cautiously because targeting, lifecycle, seasonality, and concurrent changes may contribute.
Segment and Visit evidence
Established accounts show 40.5% recurring adoption versus 5.6% for onboarding accounts; administrator-owned accounts show 41.7% versus 12.5% for manager-owned accounts. These overlapping cuts generate hypotheses and cannot be added or treated as causal.
Select Visits from discovered-not-started, started-not-completed, completed, and repeated stages across roles, lifecycle, and exposure cohorts. In the fictional sample, managers encounter permission boundaries, onboarding accounts lack prerequisites, and successful administrators enter through existing report pages. Validate how common those patterns are with population data.
Scheduled Reports
Do not call this a 70% adoption rate. 70% is discovery.
Recurring account adoption
30.0%
18 of 60 exposed
User adoption
13.3%
56 of 420 users
Penetration inside adopters
28.0%
56 of 200 users
Top-user concentration
70.0%
126 of 180 actions
Two things that move the same number
The announcement effect
Page Visits rose from 90 to 168, an 86.7% jump. Completed schedules stayed at 12. Reach moved; the workflow did not.
Turn the evidence into a release decision
Measurement
- Decision and primary entity declared
- Eligibility and exposure event auditable
- Meaningful behavior and recurrence defined
- Maturity window complete
- Account, user, penetration, and concentration reported
- Percentage points and relative changes labeled
Decision
- Funnel loss located
- Segments treated as hypotheses
- Old workflow displacement measured
- Guardrails reviewed
- Visits selected by funnel stage
- Causal language matches comparison design
- Next cohort and decision date scheduled
Make the decision reversible where evidence is immature. For example, extend a staged rollout to another comparable cohort while keeping a holdout, or change onboarding for accounts that were exposed but never started. Pair the decision with a review date, the metric movement that would confirm progress, and guardrails that would stop expansion. Preserve the original cohort definitions so a later dashboard refresh cannot silently rewrite the launch story.
When the result is mixed, separate measurement failure from product failure. Missing exposure, identity, or account context calls for instrumentation repair; high discovery with low completion calls for workflow investigation; completion without recurrence may reflect cadence, a one-time job, weak outcomes, or reliability. Each pattern deserves a next test recorded before the next readout.
Decision for the fictional release
For the fictional release, continue rollout to established administrator-ready accounts, correct eligibility, delay or redesign exposure for onboarding accounts without prerequisites, clarify manager permissions, improve the discovery-to-setup path, and remeasure a mature 28-day cohort.
Hymetry connects grouped Pages with Companies, Users, and Visits so teams can move from an account-level funnel change to its users and session evidence. It does not establish causal lift by itself.
Frequently asked questions
What is the best metric after launch?
A meaningful adoption rate for mature eligible exposed accounts, accompanied by exposure, discovery, completion, recurrence, user penetration, concentration, and guardrails.
What is a good adoption rate after release?
No universal number applies. Compare against a predeclared expectation, equivalent exposure cohorts, feature role, maturity, historical workflow, and relevant peers.
Should the denominator include all customers?
No. Include entities with access, permission, prerequisites, relevance, and a realistic opportunity under the declared definition.
How do staged rollouts change measurement?
Each entity has its own exposure date. Compare equivalent days since exposure and exclude cohorts that have not matured for the required behavior.
Can pre/post comparison prove the release caused change?
No. It is directional and can be affected by trend, seasonality, targeting, mix, and concurrent changes. A well-run randomized experiment offers stronger causal evidence.
How should a one-time setup feature be measured?
Use valid completion among opportunity-eligible accounts, then track first downstream success and reliability separately rather than requiring repeated UI visits.
Should B2B teams measure accounts or users?
Both. Accounts show customer reach; users, penetration, and concentration reveal rollout breadth and champion dependence.
How can replay help?
Select Visits from defined funnel stages to generate explanations and validate workflow evidence. Replay does not estimate prevalence or prove intent.
Sources
Method note: Controlled-experiment, rollout, cohort, time-series, matching, percentage, and qualitative-research references support the comparison hierarchy and its limits.
Methodology and evidence limits
The guide distinguishes descriptive release measurement from causal evaluation. Exposure cohorts improve opportunity alignment but do not create random equivalence. Matching and interrupted time series require diagnostics and cannot remove every confounder. Session evidence supports explanations, not population estimates.
Full source directory
- Kohavi et al., practical controlled experiments and online experiments at scale
- Microsoft progressive experimentation, Firebase rollouts, and Apple phased release
- GA4 cohort exploration and funnel exploration
- Interrupted time-series tutorial, Bayesian structural time series, and matching methods review
- ONS percentages and percentage points and NN/g qualitative versus quantitative sample use
Additional preserved references
These references supported the original detailed guide and remain available for claim verification and further reading.