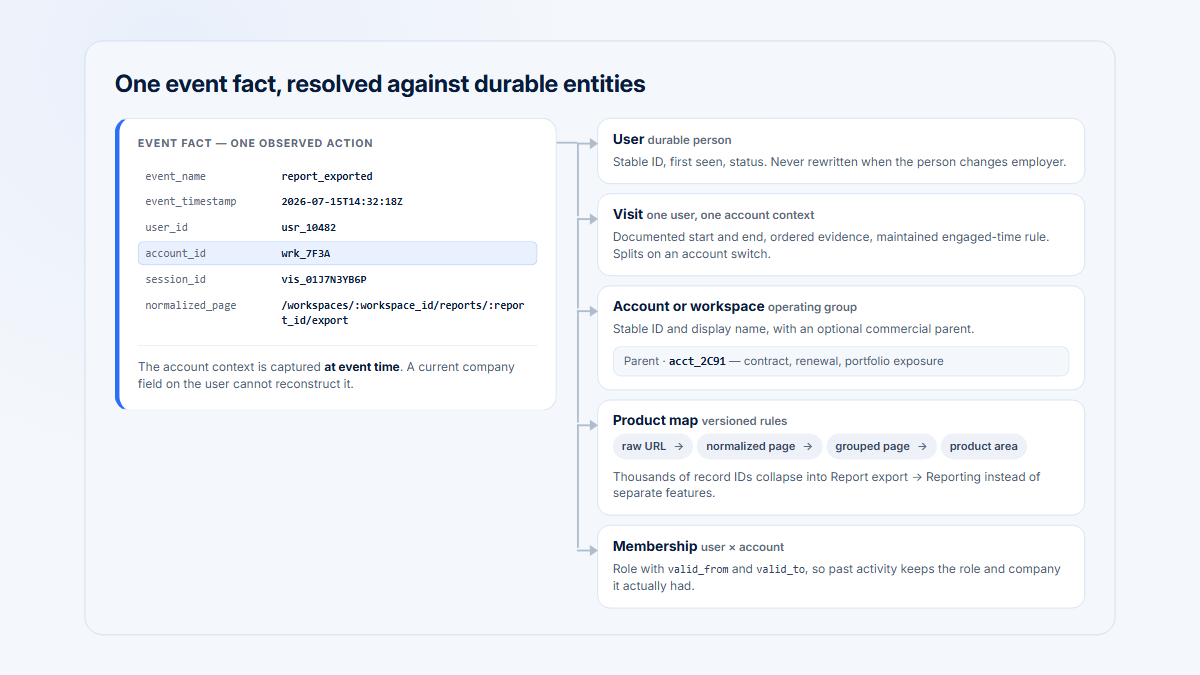
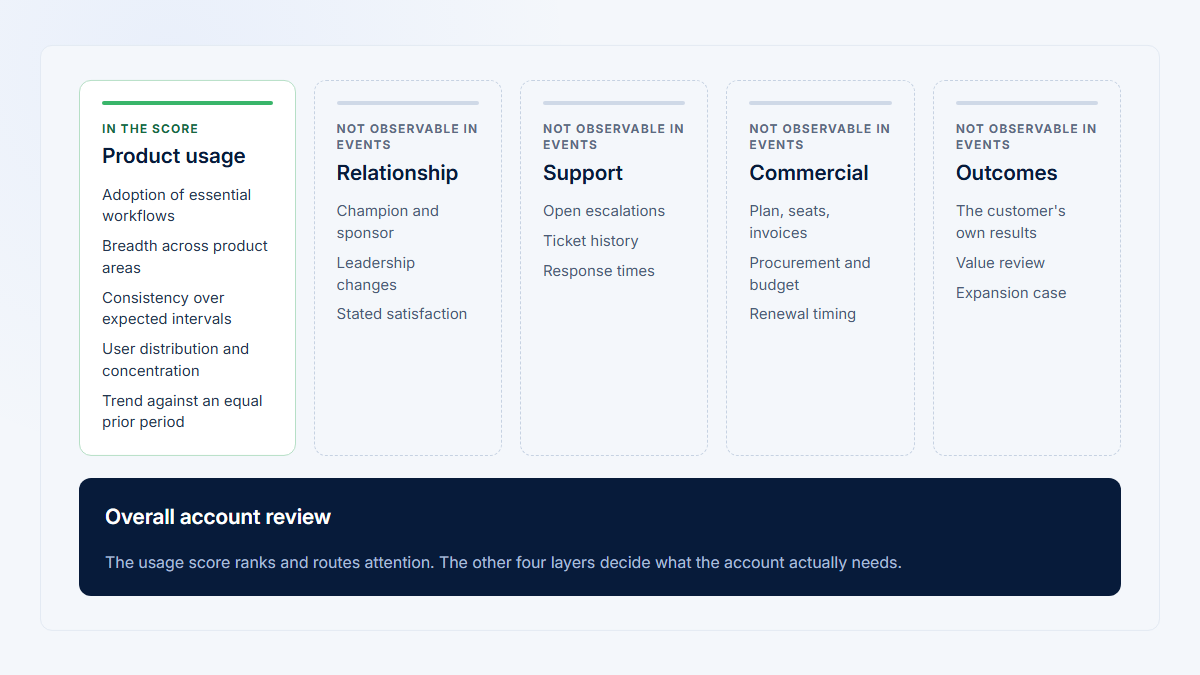
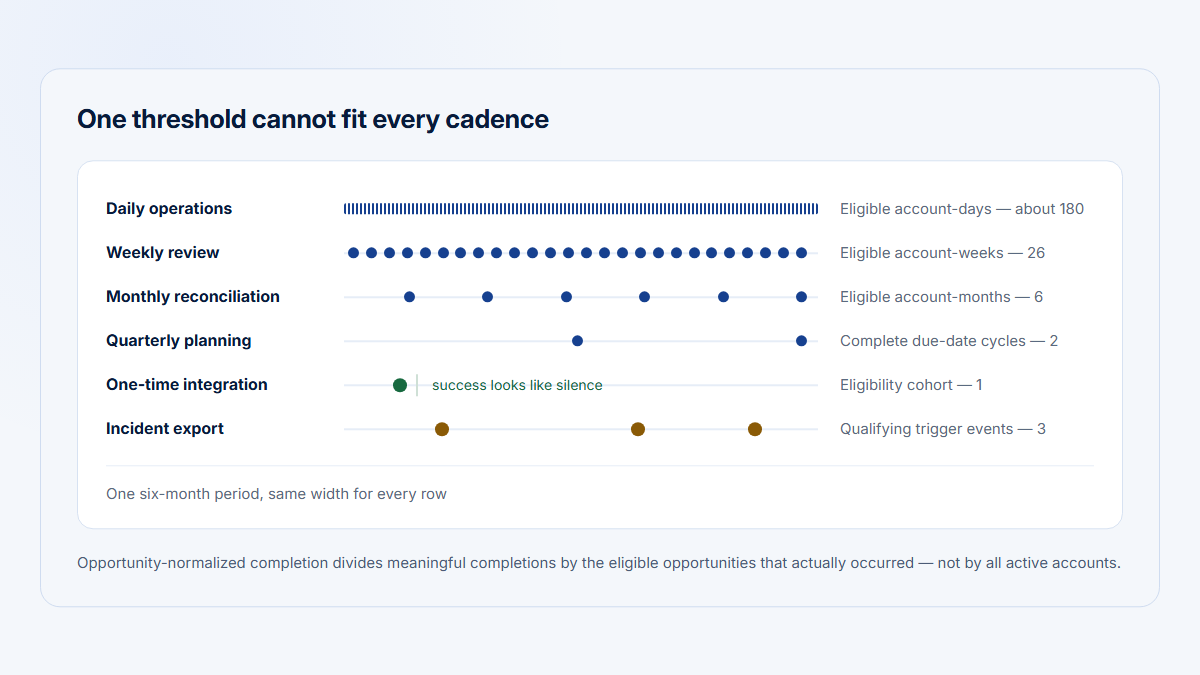
Define the baseline and metric before choosing peers
A baseline is any reference used for comparison. A benchmark is a reference value, often external or aggregated. A cohort is a population sharing a start condition or time. A peer group contains accounts judged comparable for a particular metric and decision. These terms should not be interchangeable.
Global averages combine onboarding and mature accounts, small and large customers, optional and core capabilities, human and automated workflows, and daily and monthly cadence. A mathematically correct result can still answer the wrong question.
| Metric | Question | Comparison requirements |
|---|---|---|
| Active users | How many people participated? | Account size, eligible seats, role mix |
| Active-user penetration | What share of eligible people participated? | Reliable denominator and comparable roles |
| Feature penetration | How broadly did a workflow spread? | Feature access, eligible users, qualifying use |
| Adoption breadth | How many relevant areas were used? | Applicable and available areas |
| Meaningful actions | How much qualifying work occurred? | Event definition, deduplication, automation, opportunity |
| Active days/Visits | How regularly did use occur? | Timezone, session rules, cadence, seasonality |
| Top-user concentration | How dependent is use on one person? | Role model and enough active users |
| Time to first meaningful use | How quickly was an onboarding milestone reached? | Equivalent start, setup, access, and cohort maturity |
Normalize scale where it helps
Active-user penetration = (active eligible users ÷ eligible seats or eligible users) × 100
Feature user penetration = (eligible active users who used the feature ÷ eligible active users in the account) × 100
A rate can reduce domination by raw account size, but it does not erase every size effect. Ten percent in a 10-seat account and 10% in a 1,000-seat account have different uncertainty and operational implications. Show the underlying counts.
Atlas Labs · 96 of 240 seats = 40% penetration
All active accounts
onboarding and mature, 10 seats and 1,000, weekly and monthly — pooled together
pooled 48.1%
−8.1 points
"below average" — and the sentence means nothing
7 relevant peers
mature enterprise collaboration · Reporting access · 90+ days past onboarding · 100–500 seats · weekly-or-more
43rd percentile
2 points under the median, inside the middle half — typical
7 peers, 34–52% · middle half 36–48%
Same account, same 40%. The first comparison averages onboarding accounts with mature ones and 10-seat specialists with 1,000-seat enterprises; the arithmetic is right and the question is wrong.
Construct peers from eligibility and plausible dimensions
Apply eligibility before segmentation. Accounts without access, a prerequisite, the relevant role, a realistic opportunity, or enough time to mature do not belong in the denominator. Capture eligibility at the period or event time rather than assuming today’s plan and membership always describe history.
Candidate peer dimensions include plan/access, eligible seats, lifecycle and account age, onboarding state, use case, configuration, role mix, industry or region where they change opportunity, expected cadence, integrations, and contract type where it changes product access. Add a dimension only when it plausibly influences the metric.
Mature enterprise collaboration accounts with Reporting access, at least 90 days since onboarding completion, 100–500 eligible seats, and an expected weekly-or-more workflow.
That sentence is reviewable; “similar customers” is not. Prefer a normalized metric when it removes an unnecessary dimension. Keep a size band when the same rate has materially different meaning or variance at different scales.
Exclude the account from its own baseline
Use a leave-one-out comparison. Including the account pulls the peer statistic toward its own value, especially in small groups, and can change its percentile position. Compute each account against the eligible peers remaining after that account is removed. Record whether the account is excluded consistently across interface, export, alert, and test code.
Do not over-segment until every account becomes unique. Match only the dimensions required by the decision. Consider model-based expected values only when the population, validation, explainability, and monitoring justify the additional assumptions.
Show distributions and calculation choices
B2B account metrics are often skewed. A few large or highly active accounts can pull the mean far above the typical account. The median is less sensitive to extreme tails, but no statistic is universally best. Show enough of the distribution for the reader to interpret it.
Core statistics
Median = middle ordered peer value(or the mean of the two middle values for an even count)IQR = 75th percentile − 25th percentilePeer mean = sum of peer values ÷ peer countUnweighted mean of account rates = sum of account rates ÷ number of accountsPooled rate = sum of qualifying numerators ÷ sum of qualifying denominators
The unweighted mean gives every account equal influence; the pooled rate gives larger denominators more influence. Both can be correct and answer different questions. State which one is used.
For illustrative ranking, this guide uses a tie-aware midrank:
Percentile rank
((peer values below the account + 0.5 × peer values equal to it) ÷ peer count) × 100
Quantile interpolation methods differ across software, especially with small peer sets. Select one method and use it consistently in the interface, export, tests, and historical calculations. For a small set, “above all 7 peers” can communicate uncertainty more honestly than “100th percentile.”
Differences from peers
Relative difference from median = ((account value − peer median) ÷ peer median) × 100Percentage-point difference = account rate − peer median ratez-score = (account value − peer mean) ÷ peer standard deviation
Relative difference is undefined when the peer median is zero and unstable near zero. Show an absolute or percentage-point difference, the distribution, or an unavailable state. Z-scores are not a good default for a small, heavily skewed account population; scientific-looking precision cannot repair weak distribution assumptions.
One unexplained score
Peer position
Below average
Below which accounts? Measured how? How many of them? Nothing here can be checked, argued with, or acted on.
What a peer readout has to show
Atlas Labs · active-user penetration · last 30 days
25th · 36%
75th · 48%
median 42%
0%
70%
Position
43rd pct
Gap to median
−2 pts
Peers compared
7
Fallback level
Exact
Every element on the right exists so a reviewer can disagree with the comparison. Small peer counts are honest: "above all 7 peers" says more than "100th percentile".
Use visible fallback rules and the account’s own history
There is no universal peer-count minimum. The defensible count depends on the decision, metric stability, distribution shape, ties, population change, displayed statistic, and cost of acting. Small groups can provide descriptive context, but not more precision than their data supports.
- Exact relevant peers: preserve every required metric dimension.
- Lifecycle-and-plan peers: remove a less important dimension while preserving maturity and access.
- Eligibility-matched peers: preserve ability and opportunity, relax secondary segmentation.
- Project-wide eligible population: use only if it still answers a useful question.
- Insufficient data: show no peer comparison when broadening would mislead.
Display the peer count, definition, distribution, and fallback level. Never silently turn “mature enterprise collaboration accounts” into “all active customers.”
When exact peers run out
Exact relevant peers
every dimension the metric requires is preserved
Lifecycle-and-plan peers
drop the least important dimension, keep maturity and access
Eligibility-matched peers
keep ability and opportunity, relax secondary segmentation
Project-wide eligible population
only if it still answers a useful question
Insufficient data
broadening further would mislead — so show nothing
Never silently
"Mature enterprise collaboration accounts" must never turn into "all active customers" without the reader seeing it happen.
A previous-period baseline asks whether the account changed under a stable definition. A peer baseline asks whether its current value differs from comparable accounts. Show both. An account can be below peers but improving normally during onboarding, or above peers while declining from a previously strong position.
Also inspect composition before interpreting a peer movement. The median can change because accounts entered or left the peer set, eligibility changed, an onboarding cohort matured, or the product definition changed. Preserve the prior peer count and summary so reviewers can distinguish an account change from a reference-population change.
Protect comparability over time
Segmented and aggregate results can move in different directions when customer mix changes. Report the metric inside the relevant groups before interpreting the global trend, and avoid choosing a favorable segment after seeing the outcome. Write the peer rule and fallback hierarchy in advance of a high-stakes review.
Version changes to metric logic, eligibility, peer dimensions, fallback order, quantile method, and source data. When a change breaks comparability, provide an effective date or recompute history deliberately and annotate the report.
Worked example: five fictional B2B accounts
| Account | Context | Metric | Leave-one-out peers | Peer summary | Position | Interpretation |
|---|---|---|---|---|---|---|
| Atlas Labs | Mature enterprise collaboration; 240 eligible seats | 96 active users = 40% penetration | Same access, lifecycle, use case, weekly+ cadence | 7 peers; median 42%; middle 36–48% | −2 points; ~43rd percentile | Typical despite being below the mixed raw-user mean |
| Northstar Works | Six weeks into enterprise onboarding | 30/300 = 10% | Same onboarding stage and setup state | 6 peers; median 10%; middle ~7–13% | 50th percentile | Typical for onboarding; mature comparison invalid |
| Beacon Systems | Mature specialist/admin workflow; 10 seats | 68% top-user concentration | Equivalent specialist access and role ownership | 5 peers; median 65%; middle ~60–71% | 60th percentile | Concentrated but not unusual for this use case |
| Meridian Group | Mature enterprise collaboration; 1,000 seats | 620 active users = 62% | Same access, lifecycle, use case, cadence | 7 peers; median 40%; middle ~36–45% | Above all 7 peers | Unusually broad, not a universal target or health proof |
| Harbor Analytics | Mature monthly Reporting; 50 seats | 3 active days | Same capability and monthly cadence | 6 peers; median 3 days; middle ~2–4 | 50th percentile | Typical cadence; a seven-day baseline misleads |
Across the five displayed accounts, raw active users are 96, 30, 5, 620, 18. The mixed global mean is (96 + 30 + 5 + 620 + 18) ÷ 5 = 153.8, pulled upward by Meridian; the median is 30. Atlas looks below one and above the other, yet neither describes a mature collaboration peer set.
The unweighted mean penetration is (40% + 10% + 50% + 62% + 36%) ÷ 5 = 39.6%. The pooled rate is (96 + 30 + 5 + 620 + 18) ÷ (240 + 300 + 10 + 1,000 + 50) × 100 = 48.1%. Atlas is slightly above the first and 8.1 points below the second because Meridian has more weight. The calculation is not broken; the question is underspecified.
Read Atlas and the other scenarios
For Atlas, the seven relevant peers are 34%, 36%, 39%, 42%, 45%, 48%, 52%. Atlas at 40% is 2 points below the 42% median, a relative difference of ((40 − 42) ÷ 42) × 100 = −4.8%. Three peer values are below it, so the midrank is (3 + 0.5 × 0) ÷ 7 × 100 = 42.9%. It lies inside the middle range and is reasonably described as typical.
Northstar belongs with onboarding accounts; Beacon’s concentration belongs with specialist workflows; Harbor needs a monthly window. Meridian’s high penetration warrants understanding, not a declaration that every enterprise account should match it. Higher is not automatically better for engaged time, concentration, error rates, repeated attempts, or time to first value.
Turn peer context into an accountable review
- State the decision and direction of “better” for the metric.
- Define the measured entity, numerator, denominator, period, cadence, and meaningful behavior.
- Apply eligibility, maturity, and opportunity before selecting peers.
- Choose only dimensions with a plausible relationship to the metric.
- Use the narrowest defensible group and exclude the compared account.
- Show count, median, 25th/75th percentiles, account value, and method.
- Apply and label the fallback level or show insufficient data.
- Compare with the account’s previous period under the same definition.
- Inspect product areas, users, and selected Visits to explain the pattern.
- Validate peer usefulness over time and version rule changes.
External SaaS benchmarks are the weakest layer unless entity, eligibility, feature type, threshold, period, maturity, customer mix, distribution, and quantile method match. Published vendor values can suggest questions or dimensions; they should not become targets merely because they are precise.
For recurring reviews, store a compact result record: account value and counts, previous-period value, exact peer sentence, peer count, fallback level, median, middle range, rank convention, eligibility snapshot date, rule version, and missing-data share. Link the product areas and users responsible for the difference. This makes a later decision reproducible even when the live peer population has changed.
Use proportional language and revisit the model
Use coarse language when the evidence is coarse. “Inside the middle half of seven peers” is clearer than a color-coded health label. “Above all five specialist peers” is more honest than a population percentile. When the action is costly or customer-facing, require corroborating product and account evidence.
Review the peer definition when access, packaging, workflow ownership, automation, or customer mix changes. A stable query can become conceptually obsolete even while it runs without errors. Track how often each fallback level is used and which accounts repeatedly receive insufficient data. If most comparisons require broad fallback, simplify the segmentation or redesign the metric instead of presenting fragile precision.
Common peer-comparison mistakes
- Choosing peers before defining the metric.
- Mixing ineligible, onboarding, mature, daily, and low-frequency accounts.
- Comparing raw counts without scale context.
- Including the account in its own baseline.
- Displaying a mean or percentile without distribution and count.
- Over-segmenting, then broadening silently when data is sparse.
- Treating above-median as healthy, below-median as unhealthy, or correlation as causation.
- Using one external benchmark across unlike features or rewriting definitions without versioning.
Connect peer context to account evidence
Hymetry’s Companies surface provides the account view. Teams can connect a peer difference to Pages, participating Users, and selected Visits. Peer context prioritizes a question; these evidence paths help explain it. They do not supply a universal benchmark or customer-health verdict.
Frequently asked questions
What is a peer baseline in B2B SaaS?
It is a documented distribution from accounts comparable for one metric and decision, after eligibility and lifecycle rules are applied.
How many accounts are required for a peer group?
No universal minimum applies. Show the count, uncertainty, fallback level, and insufficient-data state appropriate to the decision.
Should a peer baseline use the mean or median?
Often the median for skewed account data, but show the distribution and choose the statistic that answers the question.
How is an account percentile calculated?
Rank the account against leave-one-out peers using one documented tie and quantile convention applied consistently.
Should the company be excluded from its own peer baseline?
Yes. Otherwise it pulls the statistic toward itself, especially in small groups.
Can one account belong to several peer groups?
Yes. The relevant group can change with the metric, feature, use case, lifecycle, and cadence; label each definition.
What should happen when the peer median is zero?
Do not compute a relative percentage. Show an absolute or point difference, distribution, or unavailable state.
Does being below the peer median mean an account is unhealthy?
No. It means the value is below the middle peer value. Trend, distribution, product evidence, and account context determine the next question.
Sources
Verification note: Sources were reviewed on 3 August 2026. Statistical references support definitions and methods; vendor documentation supplies cohort/display examples, not universal B2B benchmarks.
Methodology and evidence limits
Examples use fictional data and a stated midrank convention. Sample-quantile implementations differ, particularly in small sets. Peer position is descriptive and does not establish health, value, renewal, or causation. Hymetry links describe current product terminology and investigation paths only.
Full source directory
- NIST measures of location, percentiles, measures of scale, and skewness and kurtosis
- Hyndman and Fan, Sample Quantiles in Statistical Packages
- Google Analytics benchmarking, cohort exploration, CohortSpec, and Data API advanced use cases
- Simpson, interpretation of interaction in contingency tables
- Hymetry Companies, Pages, Users, Visits, and Customer Success
Additional preserved references
These references supported the original detailed guide and remain available for claim verification and further reading.