A practical pre-renewal review workflow
- Verify data: account identity, workspaces, users, eligibility, taxonomy, events, automation, timezone, and complete periods.
- Select comparable windows: use the customer's cadence, seasonality, rollout stage, and release history.
- Summarize the account: recurring workflows, product areas, meaningful activity, active human users, and established outputs.
- Inspect distribution: roles, penetration, new and dropped users, concentration, and backup ownership.
- Explain change carefully: compare counts, rates, and product areas without hiding mixed movement.
- Investigate selectively: review only Visits tied to a specific unresolved question.
- Prepare questions and actions: validate meaning, outcomes, commercial context, ownership, and next-term priorities with the customer.
Verify the data, then narrow from account to selected evidence
Gate — before reading anything
- Renewal account matches the analytics company
- Humans only: staff, sandbox and service accounts labelled
- Plan eligibility separated from absence
- Complete periods on the customer’s own cadence
Any check fails → record the limitation instead of forcing a percentage
Aggregate first, detail second
1 Summarise the account
2 Inspect distribution
3 Explain change
4 Investigate selectively
Scope narrows at every step. Replay is opened last, never first — one vivid recording should not define the account.
Output
One-page briefing
“No action” is a legitimate outcome
- Facts with their period and counts
- Interpretations, marked as unproven
- Questions for the customer
- Actions, owners, measures
- Known limitations
A practical sequence is aggregate first, detail second. Begin with the company and product areas, move to user distribution, and inspect Visits only after a specific gap remains. This prevents a vivid recording or one power user from defining the entire account narrative.
Verify data and choose the right period
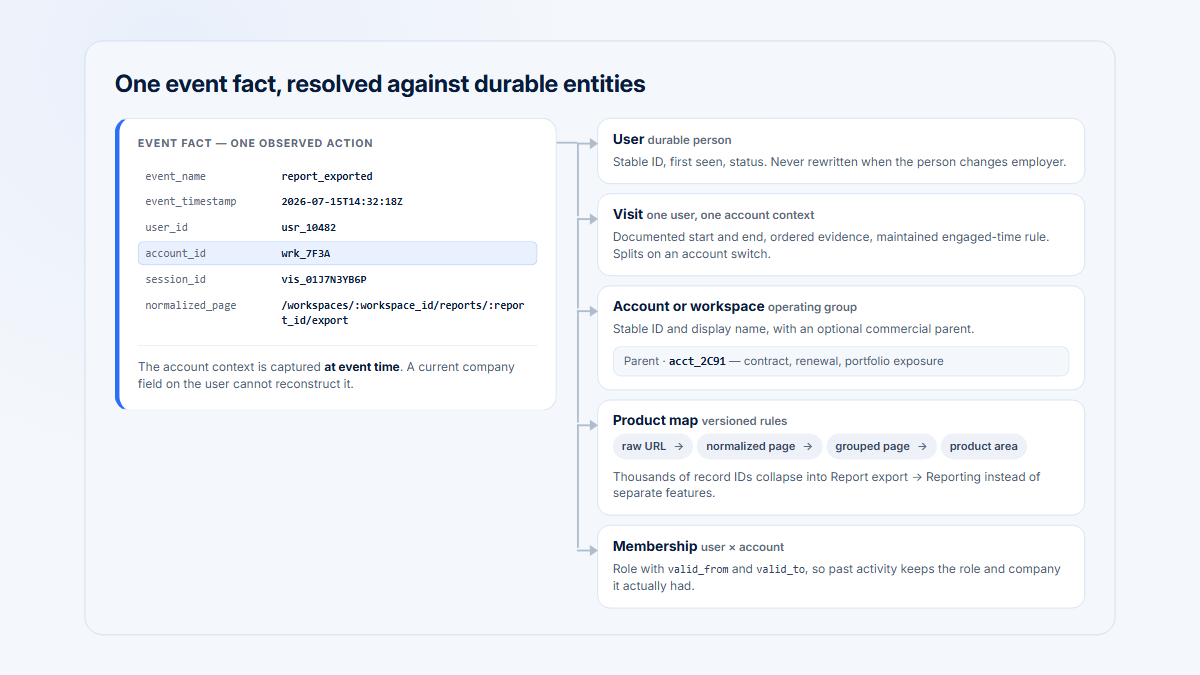
Check the account before interpreting it. Confirm stable account and user IDs, user-to-company membership, production versus sandbox workspaces, internal and support users, service accounts, feature eligibility, instrumentation changes, timezone, and whether the period is complete. Label automated activity rather than mixing it with human engagement.
The most recent seven or thirty days is not automatically appropriate. Compare complete windows that match expected use:
| Workflow | Useful view | Caveat |
|---|---|---|
| Daily operations | Recent complete weeks plus prior comparable weeks | Exclude weekends or closures where appropriate |
| Weekly project work | Several complete weekly cycles | One missed week may be normal |
| Monthly reporting or billing | Several completed monthly cycles | A seven-day window can miss the workflow entirely |
| Quarterly planning | Comparable quarters or cycle milestones | Account for seasonality and organizational change |
| Post-integration substitution | Pre/post windows around enablement | Lower manual activity may be successful automation |
When tracking or definitions changed, mark the trend as non-comparable instead of forcing a percentage. Use peer context only among genuinely comparable accounts and show the peer-group definition.
Run a data-quality preflight: confirm the renewal account matches the analytics company, consolidate or deliberately separate workspaces, exclude staff and test traffic, label integration activity, verify role and membership history, confirm plan eligibility, review release and event-definition changes, and record known gaps. A polished briefing built on a wrong company ID is worse than an explicit limitation.
Interpret absence in context
Historical context often beats a generic benchmark because it respects the customer's cadence and adoption path. Peer context can still expose an unusual pattern, but segment by comparable plan, lifecycle, use case, and scale. Report ranges or distributions where possible rather than presenting one average as a target.
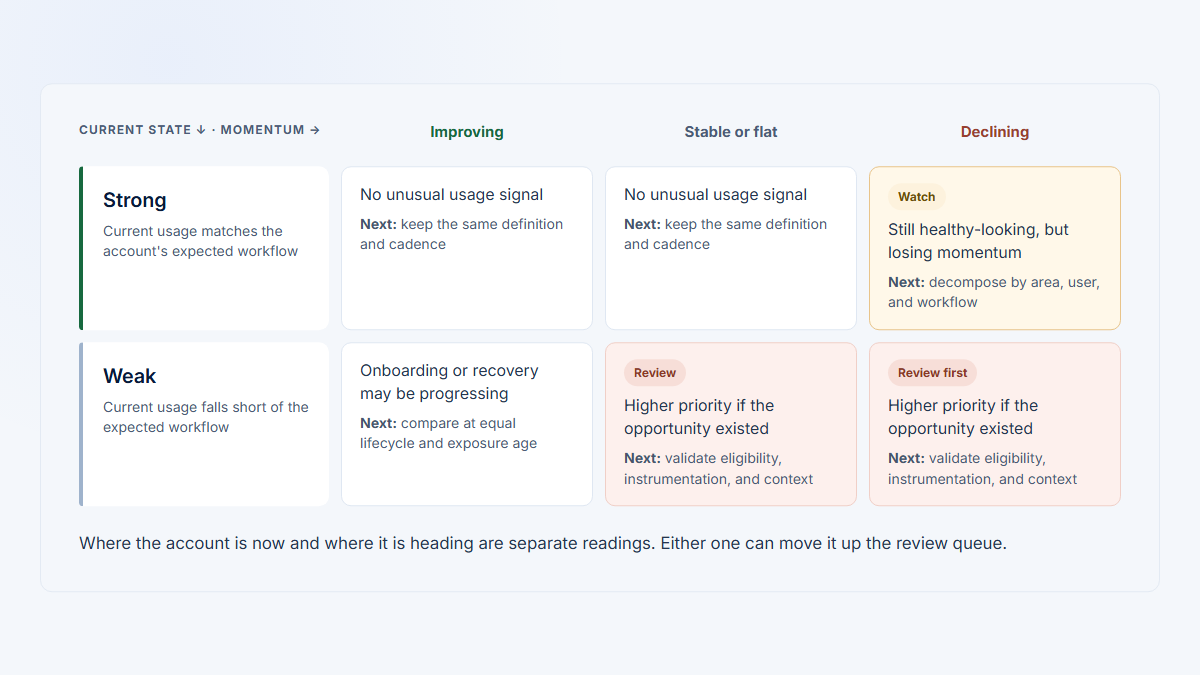
Check feature eligibility separately from absence. An account cannot be judged for an area unavailable on its plan, blocked by incomplete setup, restricted to another role, or intentionally excluded from its workflow. Keep “not eligible,” “not observed,” “not adopted,” and “unknown” as distinct states.
Build a concise account and user overview
Start with a one-page account view rather than a list of events. Include meaningful workflows, recurring outputs, active human users, eligible product areas, breadth, user penetration, top-user concentration, trend, and known customer goals. Keep product-area changes separate so growth in one workflow does not hide decline in another.
| Layer | Questions | Important qualifier |
|---|---|---|
| Account | Which meaningful workflows recur? Which areas are adopted? | Plan, setup, lifecycle, and stated goals |
| Users and roles | Who participates, who changed, and are expected roles represented? | Eligible humans only; role cadence matters |
| Distribution | Is use broad or concentrated? Is there backup ownership? | Specialist concentration may be intentional |
| Trend | Which counts, shares, workflows, or outputs materially changed? | Use complete comparable periods |
| Visits | Which selected sessions can answer a specific unresolved question? | Replay is qualitative evidence, not prevalence |
| Customer context | What outcome, ownership, budget, priority, or organizational change is known? | Customer and commercial systems supply this evidence |
Use percentage change for counts:
Percentage change
Percentage change = (current count − previous count) ÷ previous count × 100
If meaningful workflows fall from 164 to 151, (151 − 164) ÷ 164 × 100 = −7.9%. For a rate or share, report percentage points: a top-user share rising from 49% to 72% increased by 23 percentage points. Always show the underlying counts, especially when the baseline is small.
Separate facts, interpretations, and questions
Behavior becomes risky when an interpretation is written as if it were observed truth. Use three columns:
| Fact | Possible interpretation | Customer question |
|---|---|---|
| Three users created reports, down from five; one analyst created 31 of 45. | Reporting ownership became more concentrated. | Is this the intended ownership model, and who can continue the workflow if the lead analyst is unavailable? |
| Collaboration contributors fell from six to two. | The workflow may be less embedded. | Is Collaboration still relevant, or did the work move elsewhere? |
| Manual exports fell from 38 to nine after an integration became active. | Automation may have replaced manual work. | How did the process and outcome change after integration? |
| Six of 14 setup starts lacked the current completion event. | Some setup attempts may meet friction. | Have administrators had difficulty, or do they use a different path? |
Every finding travels through three columns
Fact observed, with counts
Possible interpretation one of several — unproven
Customer question neutral, asked in the meeting
Three users created reports, down from five; one analyst created 31 of 45.
Reporting ownership became more concentrated.
Is this the intended ownership model, and who continues the workflow if the lead analyst is unavailable?
Collaboration contributors fell from six to two.
The workflow may be less embedded.
Is Collaboration still relevant, or did the work move elsewhere?
Manual exports fell from 38 to nine after an integration became active.
Automation may have replaced manual work.
How did the process and the outcome change after integration?
Six of 14 setup starts lacked the current completion event.
Some setup attempts may meet friction.
Have administrators had difficulty, or do they use a different path?
Alternative explanations stay on the record
A selected replay can sharpen the question. It cannot establish frequency, outcome or intent.
Record alternative explanations and confidence. Decline can reflect seasonality, role change, automation, project completion, or instrumentation. Growth can reflect a one-time migration, repeated friction, or automated volume. A selected replay can help refine a question but cannot establish frequency or intent.
When replay is justified, define the sample before watching: the affected workflow and period, eligible accounts and roles, successful and incomplete outcomes, privacy exclusions, and a cap per user. Compare a few unsuccessful Visits with successful examples. Record visible sequence and interface state, then return to complete event and technical data.
Keep the briefing falsifiable
Keep facts, interpretations, and questions in the briefing even when confidence is high. Add the source period, affected users or accounts, alternative explanation, confidence, and next validation step. This makes it possible for another teammate to challenge the conclusion without reconstructing the analysis.
Create the one-page briefing
Keep detailed charts available for follow-up, but put only decision-relevant evidence on the meeting brief:
- Context: lifecycle, renewal timing, plan, goals, rollout history, organizational changes, and included workspaces.
- Usage summary: current and comparison periods, meaningful workflows, users, areas, distribution, and trend.
- Established evidence: recurring outputs, participating roles, adopted areas, and customer-confirmed outcomes already on record.
- Changes: participation, concentration, dropped or new areas/users, workflow friction, integrations, and gaps.
- Questions: goals, ownership, relevance, missing roles, workflow changes, next-term priorities, and commercial context.
- Actions: support, training, workflow improvement, backup ownership, setup correction, product feedback, expansion investigation, or no action.
- Limitations: missing events, identity uncertainty, automation, incomplete periods, seasonality, eligibility, and unobservable outcomes.
The evidence supports a mixed briefing, not “usage declined, so Northstar is at risk.” It supports questions about outcomes, workflow substitution, ownership, backup coverage, Collaboration relevance, setup, organizational change, and commercial context.
It also contains counterevidence: Reporting and Dashboard remain recurring, outputs remain stable, the integration runs, and the new analyst is gaining momentum. Showing only negative changes would be analytically incomplete and would make the meeting unnecessarily adversarial.
Write a mixed briefing
The Northstar briefing should therefore show established value evidence and uncertainty side by side. Reporting output is steady, but participation narrowed. Manual exports declined, but automation may explain the change. Administration has incomplete starts, but previous tracking is not comparable. Collaboration declined, but the workflow may have moved elsewhere. Each observation earns a question, not a conclusion.
Illustrative briefing: Northstar Works moved in both directions
Account
Northstar Works
Renewal
12 Feb
Windows compared
3 complete months vs prior 3
Scope
Production only · humans only
Counts: change against the prior window
Meaningful human workflows
−7.9%
164 → 151
Active human users
−33%
9 → 6
Reporting outputs delivered
+7.1%
42 → 45
Collaboration contributors
−67%
6 → 2
Manual exports integration went live
−76%
38 → 9
no changefewermore
Share held by the top user
Prior window
Current window
+23 percentage points — a share, so never reported as a percentage change
New analyst, workflows per month
Counter-evidence: participation narrowed while one user is still ramping up
Reading: not “usage declined, so Northstar is at risk.” Outputs held, the integration runs and a new analyst is ramping, while participation narrowed and ownership concentrated. Mixed evidence earns questions, not a verdict.
Use the briefing in the meeting and follow up
Lead with customer goals and organizational changes, then review recurring workflows and ask what outcomes they support. Discuss changes as questions, not verdicts. Confirm stakeholders, ownership, commercial constraints, next-term priorities, actions, owners, and measurements. The dashboard supports the agenda; it is not the agenda.
After the meeting, update facts with what the customer confirmed. Assign support or product work before pushing expansion. Define follow-up measures with expected cadence, such as whether a backup user completes a recurring workflow, whether setup completes after a fix, or whether an apparently unused area is intentionally irrelevant.
Use a decision-ready agenda
A concise agenda can follow this order: reconfirm goals and organizational changes; review established workflows and customer-confirmed outcomes; discuss changes as neutral questions; address support or setup needs; confirm next-term stakeholders and priorities; then agree actions, owners, due dates, and measurements. Commercial negotiation belongs in the appropriate part of the process, not hidden inside an analytics walkthrough.
Language matters. Prefer “Reporting participation narrowed from five creators to three” over “the account disengaged,” and “six setup starts lacked the current completion event” over “administrators failed.” Say what was measured, then invite the customer to explain what the product cannot observe.
Record the follow-up
Useful follow-up records include the customer-confirmed outcome, whether a suspected workflow remains relevant, the named owner and backup, agreed product or support actions, commercial constraints, and the next measurement window. If the customer disproves a hypothesis, preserve that correction so the same misleading signal does not repeatedly trigger outreach.
“No action” is legitimate. A low-frequency workflow may be healthy, a specialist may be the intended owner, an unused area may be irrelevant, and a change may be explained by automation. Renewal preparation should improve accuracy, not manufacture urgency.
How Hymetry connects the evidence
Hymetry's Company view connects account adoption and product-area trends to the Users contributing to them and the Visits behind selected questions. This helps a team move from portfolio signal to inspectable evidence without treating a session or user label as a renewal prediction.
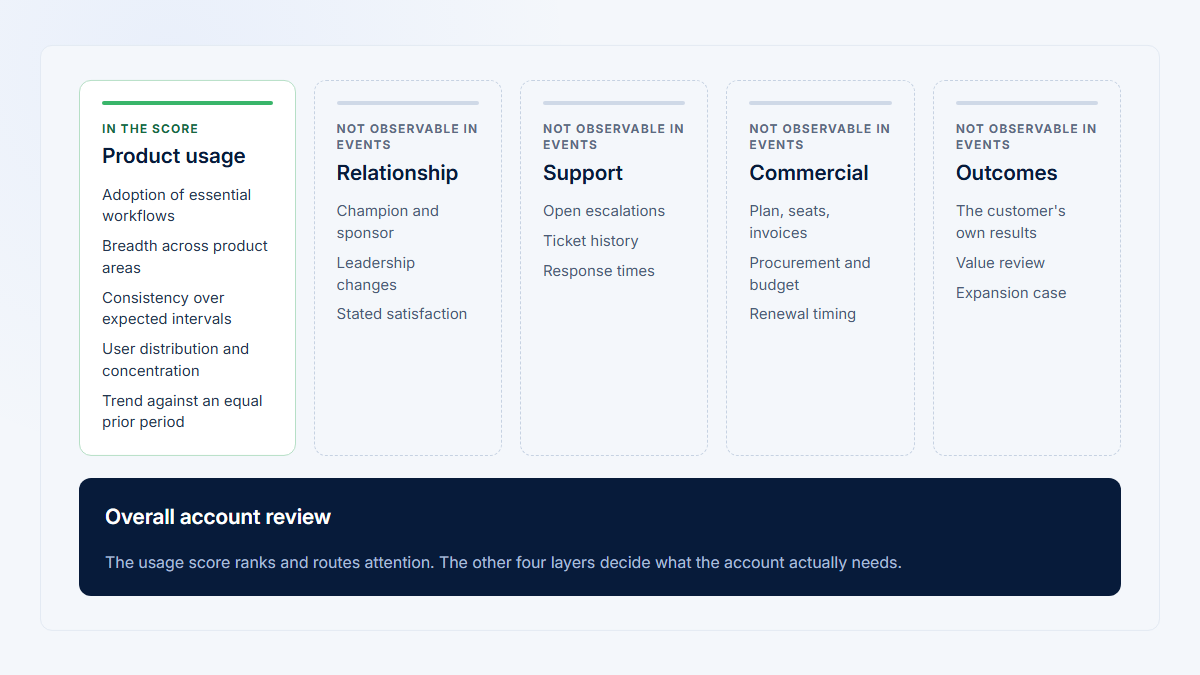
Customer goals, outcomes, contract state, support history, and procurement context still come from the customer and the systems that own those facts.
Frequently asked questions
Which usage metrics belong in a renewal briefing?
Use a small set tied to known workflows: recurring meaningful activity, adopted areas, active human users, role coverage, penetration, concentration, changes, and established outputs.
How far back should I review?
Use enough complete periods to cover the customer's real cadence and seasonality. Compare like-for-like windows and disclose tracking or rollout changes.
Does declining usage mean the customer will churn?
No. It is a signal to investigate. Product data cannot establish satisfaction, organizational change, budget, procurement, or renewal intent.
Does growing usage prove expansion?
No. Growth may be healthy, temporary, automated, or friction-driven. Validate an adjacent customer need and commercial context separately.
Is one power user always a concentration risk?
No. Specialist ownership may be correct. Ask whether the role is intentional, the output creates account value, and backup continuity is adequate.
Should I show a session replay in the meeting?
Usually keep replay internal. Use it to prepare a neutral question unless a specific, consented support workflow justifies sharing it.
What if the customer disproves the hypothesis?
Update the record. The purpose of the briefing is to learn accurately, not defend an analytics narrative.
Sources
Renewal, customer-success, and questioning practice
Measurement, identity, and privacy
- Mixpanel: Group Analytics
- Twilio Segment: Group specification
- Twilio Segment: Data collection best practices
- Google Analytics: Reporting data expectations
- UK ONS: Percentages and percentage points
- EU General Data Protection Regulation
- US FTC: Privacy and security guidance
- CNIL draft session-replay recommendation (closed consultation; non-binding draft)