Define an at-risk account as an investigation priority
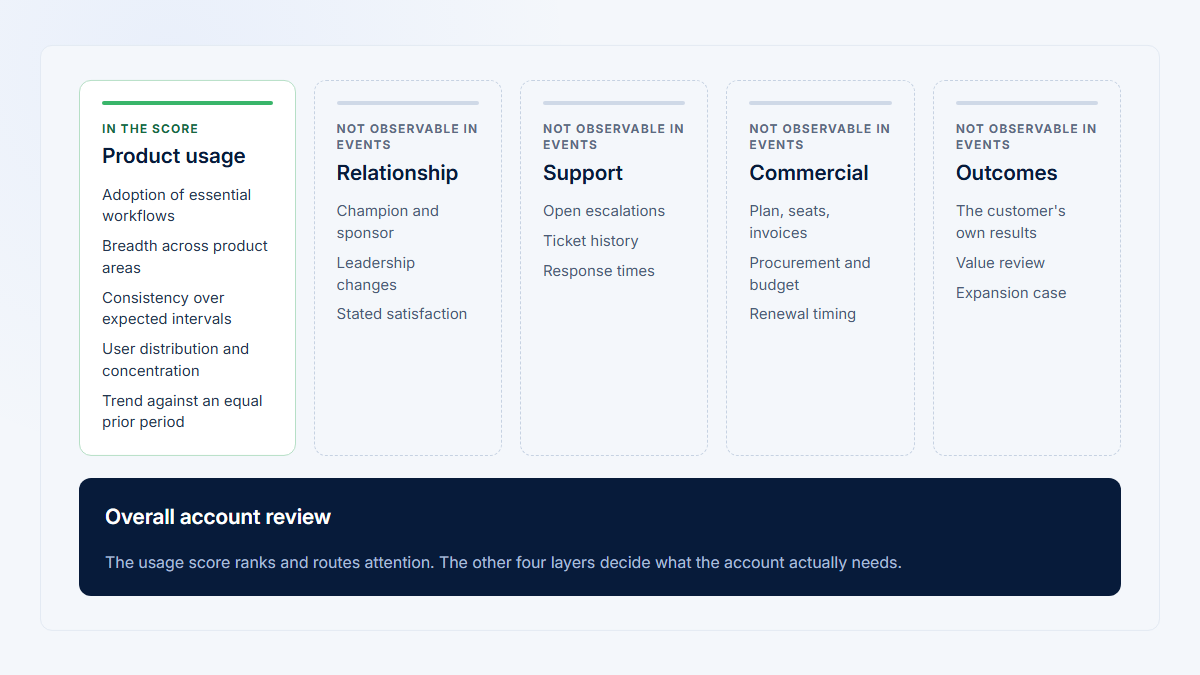
For product-usage analysis, an at-risk account is a customer company whose recent behavioral evidence differs materially from its own expected pattern, relevant peers, or required workflow in a way that deserves review. That evidence can prioritize investigation. It does not, by itself, prove dissatisfaction, renewal risk, employee departure, or future churn.
Complete customer risk can include commercial, relationship, support, implementation, security, financial, and product-outcome evidence that product analytics does not contain. Keep those sources distinct and preserve their provenance. A product-usage flag should say what changed and what to inspect next, not hide the components inside an unexplained red score.
| Current state | Momentum | Interpretation | Next check |
|---|---|---|---|
| Strong | Improving or stable | No unusual usage signal | Keep the same definition and cadence |
| Strong | Declining | Still healthy-looking, but losing momentum | Decompose by area, user, and workflow |
| Weak | Improving | Onboarding or recovery may be progressing | Compare at equal lifecycle/exposure age |
| Weak | Declining or flat | Higher review priority if opportunity existed | Validate eligibility, instrumentation, and context |
Current state ↓ · momentum →
Improving
Stable or flat
Declining
Strong
Current usage matches the account's expected workflow
No unusual usage signal
Next: keep the same definition and cadence
No unusual usage signal
Next: keep the same definition and cadence
Watch
Still healthy-looking, but losing momentum
Next: decompose by area, user, and workflow
Weak
Current usage falls short of the expected workflow
Onboarding or recovery may be progressing
Next: compare at equal lifecycle and exposure age
Review
Higher priority if the opportunity existed
Next: validate eligibility, instrumentation, and context
Review first
Higher priority if the opportunity existed
Next: validate eligibility, instrumentation, and context
Where the account is now and where it is heading are separate readings. Either one can move it up the review queue.
Use transparent signals and formulas
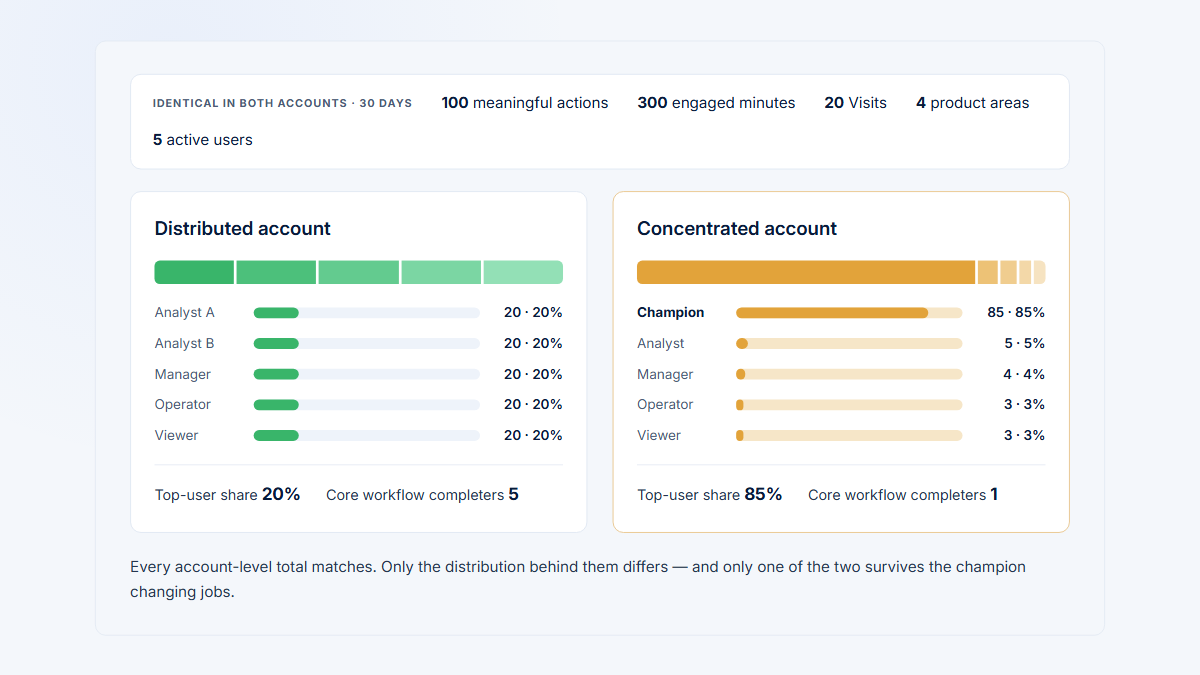
Start from account-level signals that can be reproduced. Meaningful activity is a completed or sufficiently advanced product behavior tied to the intended job, not every login, view, or click. Adoption breadth is the number of eligible product areas with qualifying use. Participation and concentration reveal whether stable totals depend on fewer people.
| Signal | Possible concern | Alternative explanation | Inspect | Next question |
|---|---|---|---|---|
| Meaningful activity declines | Less completed work | Fewer opportunities, seasonality, efficiency | Comparable cycles and outputs | Did expected work actually disappear? |
| Breadth contracts | Previously adopted workflows disappear | Feature substitution or changed use case | Areas, routes, events, product records | Where did the job move? |
| Active users fall | Participation is narrowing | Team or role ownership changed | Eligible users and roles at event time | Is narrower ownership intended? |
| Concentration rises | One champion carries the account | Legitimate specialist workflow | Per-user contribution and role coverage | Is backup ownership required? |
| Starts rise, completions fall | Workflow friction or failure | Instrumentation changed | Outcome events, errors, product records, Visits | Where does progress stop? |
| UI activity falls | Use may be declining | Automation, API, or integration substitution | System outcomes and human review | Is value delivery still reliable? |
| Account is below peers | Usage differs from similar accounts | Wrong peer group or lifecycle | Own history, eligibility, peer distribution | Is the comparison defensible? |
Core formulas
Percentage change = ((current meaningful activity − previous meaningful activity) ÷ previous meaningful activity) × 100Breadth change = current adopted product areas − previous adopted product areasActive-user change = current distinct active users − previous distinct active usersTop-user concentration = (meaningful activity from the most active user ÷ total meaningful account activity) × 100Retained-area rate = (areas used in both periods ÷ areas used previously) × 100Opportunity-adjusted recurrence = (eligible intervals with qualifying use ÷ eligible intervals with a realistic opportunity) × 100
For 810 current actions versus 825 previously, meaningful activity changed by ((810 − 825) ÷ 825) × 100 = −1.8%. If one user produced 616 actions, concentration was (616 ÷ 810) × 100 = 76.0%. A move from 34% to 76% is +42 percentage points, not a 42% increase.
Percentage change is undefined when the previous value is zero. Label new activity, show the absolute change, use a longer baseline, evaluate activation milestones, or mark history insufficient. Do not display infinity or invent a denominator. Every metric record should include its entity, numerator, denominator, qualifying behavior, eligibility, cadence, opportunity, automated-actor treatment, missing-data behavior, owner, and version.
Signals · each with its counter-explanation
Account context applied before any flag
- Lifecycle
- Eligibility
- Cadence
- Realistic opportunity
- Operating context
- Substitution
- Data quality
A signal that survives all seven is worth a person's time. One that does not is a definition problem, not an account problem.
Output · an investigation priority
What changed, what to inspect next, and who owns the answer
- No unusual signal
- Needs review
- Urgent
Not an output
A churn probability · a renewal verdict · an automated "we noticed you stopped using us" email
Align cadence, lifecycle, eligibility, and account context
A daily workflow, monthly reporting cycle, one-time setup, and event-driven incident process should not share one inactivity threshold. Define the realistic opportunity: when could this account or role have performed the behavior? Compare complete cycles and allow outcomes enough time to mature.
- Lifecycle: compare onboarding accounts with onboarding expectations and mature accounts with mature ones.
- Eligibility: respect plan, permissions, prerequisites, feature flags, region, and event-time account membership.
- Cadence: use daily, weekly, monthly, seasonal, or opportunity-based windows that match the job.
- Operating context: check holidays, closures, migrations, reduced transaction volume, planned implementation work, and account changes.
- Substitution: verify APIs, integrations, scheduled jobs, and alternative features before calling UI decline a loss of value.
- Data quality: inspect identity loss, route or event changes, duplicate actors, missing periods, and environment contamination.
Peer deviation adds context only after these rules are applied. A peer median is not a required target, and being below it is not a diagnosis. Use the account’s own comparable history alongside a relevant peer distribution.
Build an auditable eligibility and opportunity record
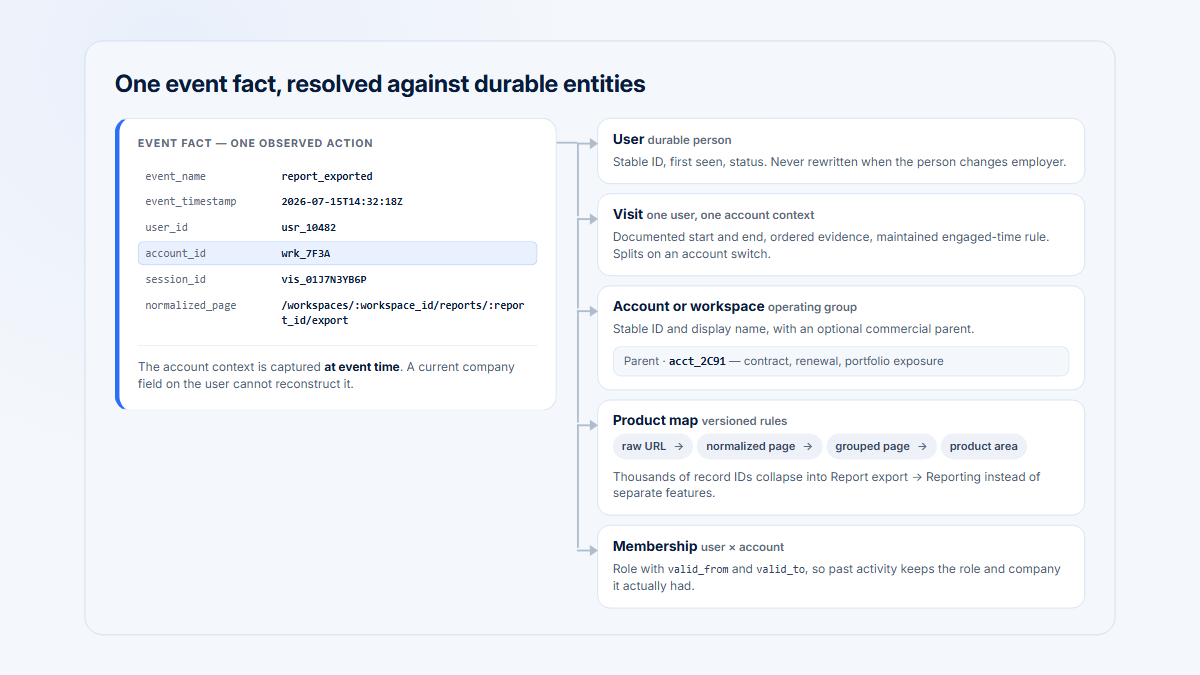
For each signal, store or reconstruct whether the account could reasonably perform the behavior in each interval. Include plan and feature access, rollout flag, permission, prerequisite state, account lifecycle, expected cadence, implementation status, and any known suspension or closure. For users, preserve the active account and role at event time so a later membership change does not rewrite historical participation.
Separate “no opportunity,” “eligible but no activity,” “missing evidence,” and “activity through another channel.” These states should not all become zero. A scheduled monthly report that is not yet due, an integration producing outputs, a tracker outage, and an eligible account that missed a required workflow demand different interpretations and actions.
Document timezone and period boundaries. Compare complete intervals and treat partial current periods explicitly. If a workflow has a delay between request and server outcome, allow a maturity window before marking it incomplete. Late-arriving events should update the evidence with an audit note rather than silently changing a closed review.
Worked example: six fictional accounts
| Account | Observed change | Context | Interpretation | Priority | Next question |
|---|---|---|---|---|---|
| Atlas Labs | Activity −11.9%; breadth 5→5; users 13→12 | Documented company closure; normal completed Visits return | Temporary interruption with stable distribution | No unusual usage signal | Does recurrence resume next comparable period? |
| Northstar Works | Activity −1.8%; users 6→2; concentration 34%→76% | One admin produces 616 of 810 actions | Stable totals hide dependency on one person | Needs review | Is narrower role coverage intended and resilient? |
| Beacon Systems | Activity −58.1%; areas 3→1; users 7→3 | Reporting and Collaboration disappear | Multi-signal adoption contraction is plausible | Needs review | Did work move, lose an owner, or become blocked? |
| Meridian Group | Human UI activity −89.2%; automated outputs 30→31 | Integration performs daily work; humans review monthly | Interface decline reflects substitution | No unusual usage signal after check | Are automation and exception review reliable? |
| Harbor Analytics | 19 days without UI activity | Monthly report completed on schedule | Seven-day rule uses the wrong cadence | No unusual usage signal | Has an eligible monthly cycle been missed? |
| Summit Operations | Page views +21.9%; completions −59.1%; 14 starts/3 completions | Visits show Settings → Permissions → Import → exit and a permission error | Activity without progress indicates friction | Urgent product/account investigation | Which dependency blocks completion? |
Beacon retained one of three previously used areas, so its retained-area rate is (1 ÷ 3) × 100 = 33.3%. That number supports the contraction finding but does not explain the cause. Northstar shows why volume alone is insufficient; Meridian shows why interface decline can be healthy; Harbor shows why cadence precedes recency; Summit shows why high activity can represent repeated failure.
Atlas Labs
Documented company closure; Visits return complete. A short interruption with a stable distribution.
No unusual signalNorthstar Works
One admin produces 616 of 810 actions. The total barely moved; the dependency did.
Needs reviewBeacon Systems
Reporting and Collaboration disappear — retained-area rate 33.3%. Contraction across several signals at once.
Needs reviewMeridian Group
An integration performs the daily work and humans review monthly. The interface drop is substitution, not loss.
No signal after checkHarbor Analytics
A seven-day inactivity rule applied to a monthly cadence. The rule is wrong, not the account.
No unusual signalSummit Operations
Visits show Settings → Permissions → Import → exit, with a permission error. Activity without progress.
UrgentTwo of these six need a person. The other four need a better rule — and the totals alone told you which was which in none of the cases.
Turn usage changes into a transparent review
- State the decision and measured account behavior.
- Define eligibility, opportunity, cadence, lifecycle, and comparable periods.
- Calculate state and momentum for meaningful activity, breadth, recurrence, users, and concentration.
- Compare with the account’s own history and a defensible peer group.
- Check automated or alternative workflows and product/instrumentation changes.
- Inspect product areas, contributing or missing users, outcomes, errors, and selected Visits.
- Add support, customer, implementation, and commercial context without merging provenance.
- Assign a review priority with explicit reasons and a next question.
- Choose an owner, action, remeasurement date, and the evidence that would change the decision.
Useful actions are specific: validate a permission barrier, confirm workflow ownership, review integration failures, support onboarding, or monitor the next complete cycle. Avoid automated outreach from one signal. A poorly timed “we noticed you stopped using the product” message can be wrong, intrusive, or harmful.
Operate the review queue as a learning system
Attach the triggering components, comparison periods, definition versions, and evidence links to every queue item. Let reviewers record whether the signal represented expected cadence, a data problem, automation, a product barrier, an account change, an unresolved pattern, or a confirmed customer concern. Those outcomes improve rules and expose recurring false positives; they are not automatically churn labels.
Prioritize combinations that imply an actionable question: breadth contraction plus lost role coverage, repeated workflow failures after start, or missed opportunity-adjusted recurrence. A single moderate decline can wait for another complete cycle when the cost of delay is low. A severe completion failure during onboarding may deserve immediate product and implementation attention even if renewal is distant.
Measure and close the review loop
Measure queue precision in operational terms: what share of reviewed flags contained a real, actionable issue under the stated definition? Also monitor coverage, time to review, repeated alerts for the same unresolved cause, reviewer disagreement, and segment-specific false positives. If reviewers cannot explain why an account was prioritized, simplify the rule.
Close the loop without manufacturing certainty. A reviewer can resolve a flag as expected behavior, confirmed instrumentation defect, product friction, account-context change, or unresolved. Preserve the evidence and reviewer rationale, then remeasure under the same definition. Do not backfill a favorable explanation into the historical signal, and do not use a customer-success note as a ground-truth churn label unless the modeling protocol explicitly defines and validates it.
Common false positives and review mistakes
- Using logins, page views, or total events as the primary health signal.
- Applying one inactivity window to every account.
- Ignoring cadence, lifecycle, eligibility, seasonality, automation, substitution, and feature changes.
- Letting one champion hide falling participation.
- Treating the peer median as a target or missing data as poor health.
- Inferring dissatisfaction, employment changes, or churn from telemetry.
- Combining components into an opaque score or changing definitions without versioning.
- Using selected replays as prevalence evidence.
Call a model predictive only after outcome validation
A rules-based review queue is not a churn model. Predictive claims require a defined future outcome and horizon, time-ordered training and testing, leakage controls, representative labels, calibration, and performance reporting that reflects the action. Renewal and churn labels can be delayed, contract-driven, and confounded by commercial processes.
Evaluate precision and recall at the operating threshold, calibration, lift over a simple baseline, stability across segments and time, false-positive cost, and intervention capacity. Keep training features available at prediction time. Validate on later periods, not a random split that lets future patterns leak backward.
Protect the outcome window
Use an observation cutoff that precedes the outcome window. Exclude renewal data, support outcomes, or account states that were recorded only after the prediction time. Handle censored contracts and accounts without a completed outcome period explicitly. Recheck calibration as customer mix, pricing, product access, tracking, and intervention policy change.
A model can rank accounts usefully while its probabilities are poorly calibrated, or appear accurate because the majority outcome dominates. Report a confusion matrix or precision-recall measures at the actual review capacity, compare with a simple recency or prior-rate baseline, and show performance by lifecycle and account segment. Human review and a rollback path remain necessary when decisions affect customers.
Model-governance record
Record the population, outcome, horizon, censoring rules, label sources, feature availability time, split dates, missing-data handling, calibration method, performance by segment, threshold, reviewers, intervention, monitoring, and rollback plan. Document that an observed association is not proof that changing the signal will change renewal.
Connect account changes to their underlying evidence
Hymetry’s Companies view provides the account starting point. Teams can open the contributing Pages, identify relevant Users, and inspect selected Visits. Those surfaces help explain a product-usage pattern; the customer-success process remains responsible for combining it with account context and choosing an appropriate action.
Frequently asked questions
What is an at-risk account in B2B SaaS?
It is an account with behavioral or contextual evidence worth investigating. Product usage alone does not prove churn or dissatisfaction.
Which product-usage risk signals are most useful?
Meaningful activity, adoption breadth, recurrence, active-user participation, concentration, role coverage, completion, and change over time are stronger together than one total.
How many inactive days should trigger a risk alert?
No universal number applies. Use the feature’s expected cadence, realistic opportunity, lifecycle, and complete comparison cycles.
Can product analytics predict customer churn?
Only a separately validated model can support that claim. A usage rule or score is an investigation aid until tested against future outcomes.
Is high top-user concentration always risky?
No. It can be appropriate for specialist workflows. It matters when broad role coverage or backup ownership is expected.
Should a usage alert contact the account automatically?
Usually not from one signal. Validate the evidence and account context, then let an accountable person choose the action.
How often should usage risk be recalculated?
Often enough to match the workflow cadence and action window. Daily processing does not justify a daily interpretation for a monthly job.
How does Hymetry help investigate at-risk accounts?
It connects company-level changes with pages, users, and Visits so teams can inspect what contributed to the pattern.
Sources
Method note: The usage signals prioritize investigation; they are not presented as a validated churn model. The example data and visual frameworks are original and fictional.
Methodology and evidence limits
Cohort, funnel, UX, and forecasting sources support transparent population and time-series analysis. Machine-learning sources support time-ordered validation, calibration, and precision-recall cautions. Gainsight describes common customer-health practice; it does not validate these fictional examples. Hymetry sources describe product surfaces only.
Full source directory
- Google Analytics cohort exploration and funnel exploration
- Google Research HEART framework
- Forecasting time-series patterns and time-series cross-validation
- scikit-learn common pitfalls, probability calibration, precision-recall, and TimeSeriesSplit
- NIST AI RMF Manage playbook and Penn State cautions about association
- Gainsight customer health score methodology
- Hymetry Companies, Users, Pages, Visits, and Customer Success
Additional preserved references
These references supported the original detailed guide and remain available for claim verification and further reading.